

Market Wrap

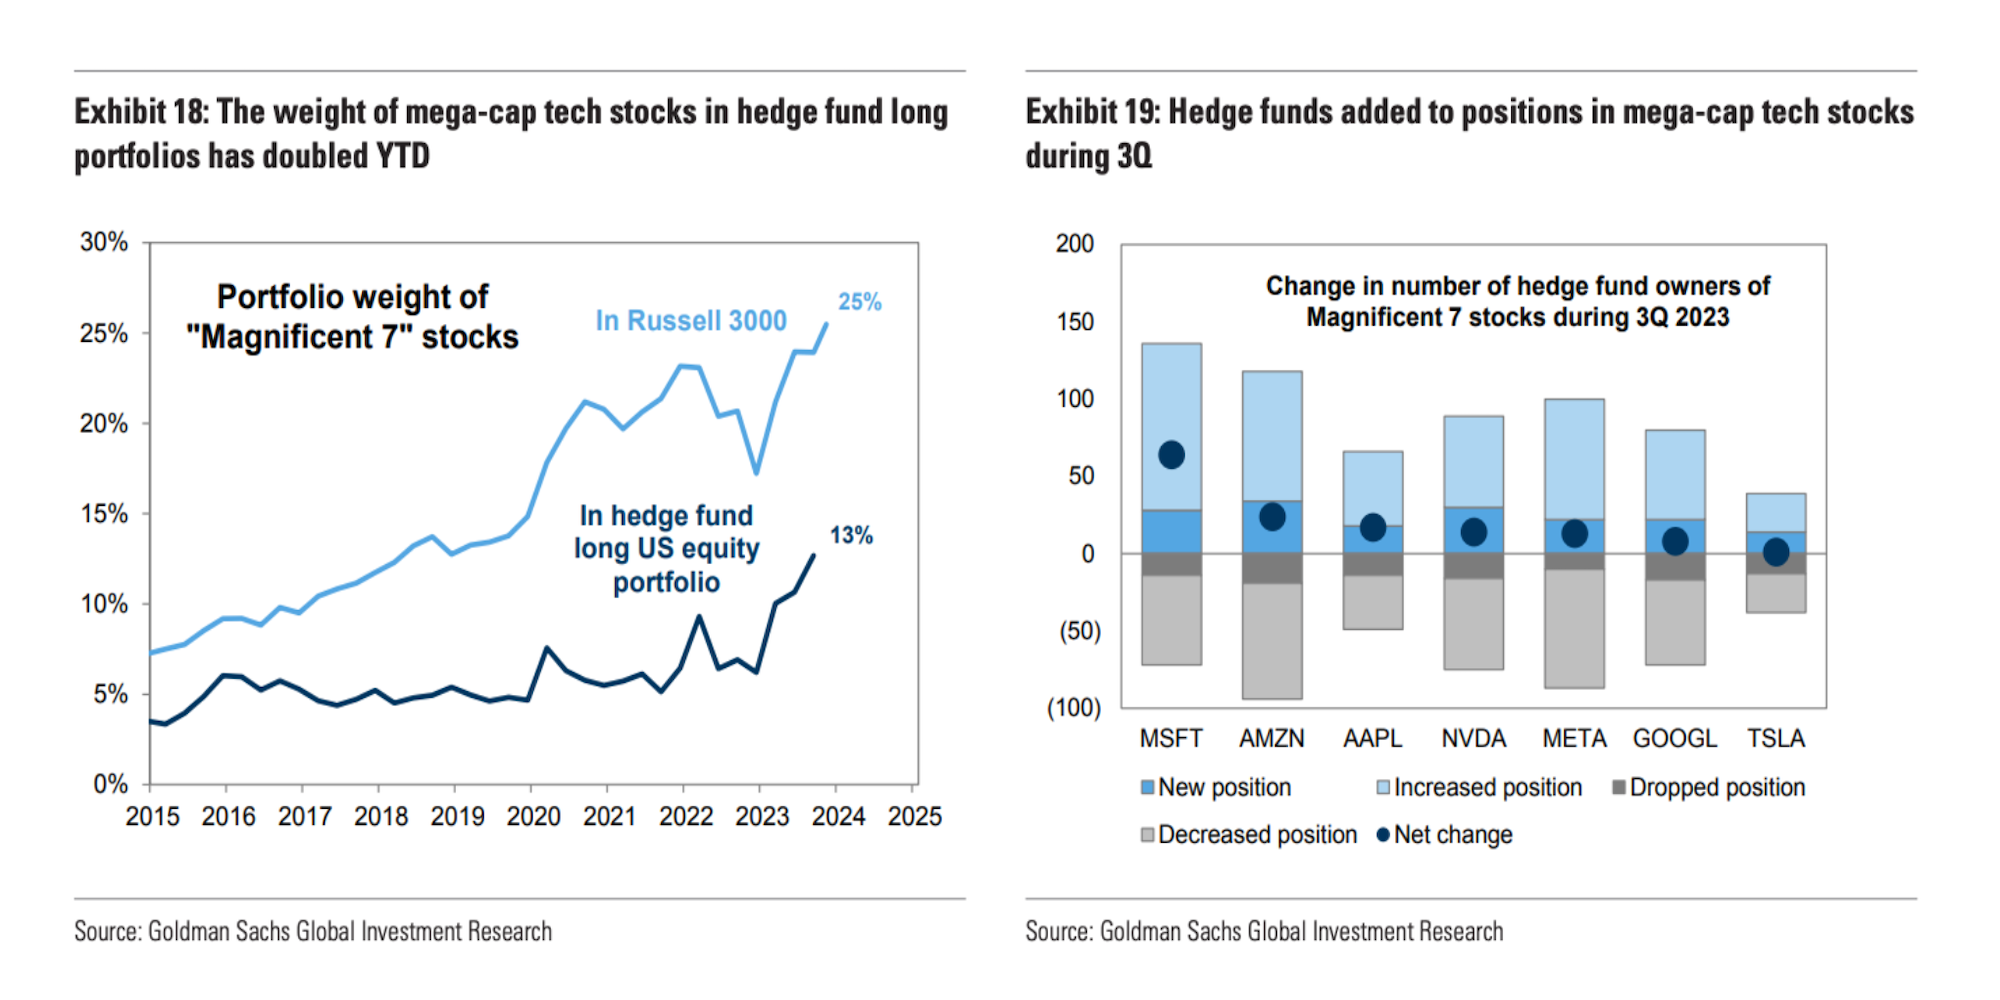
Narratives

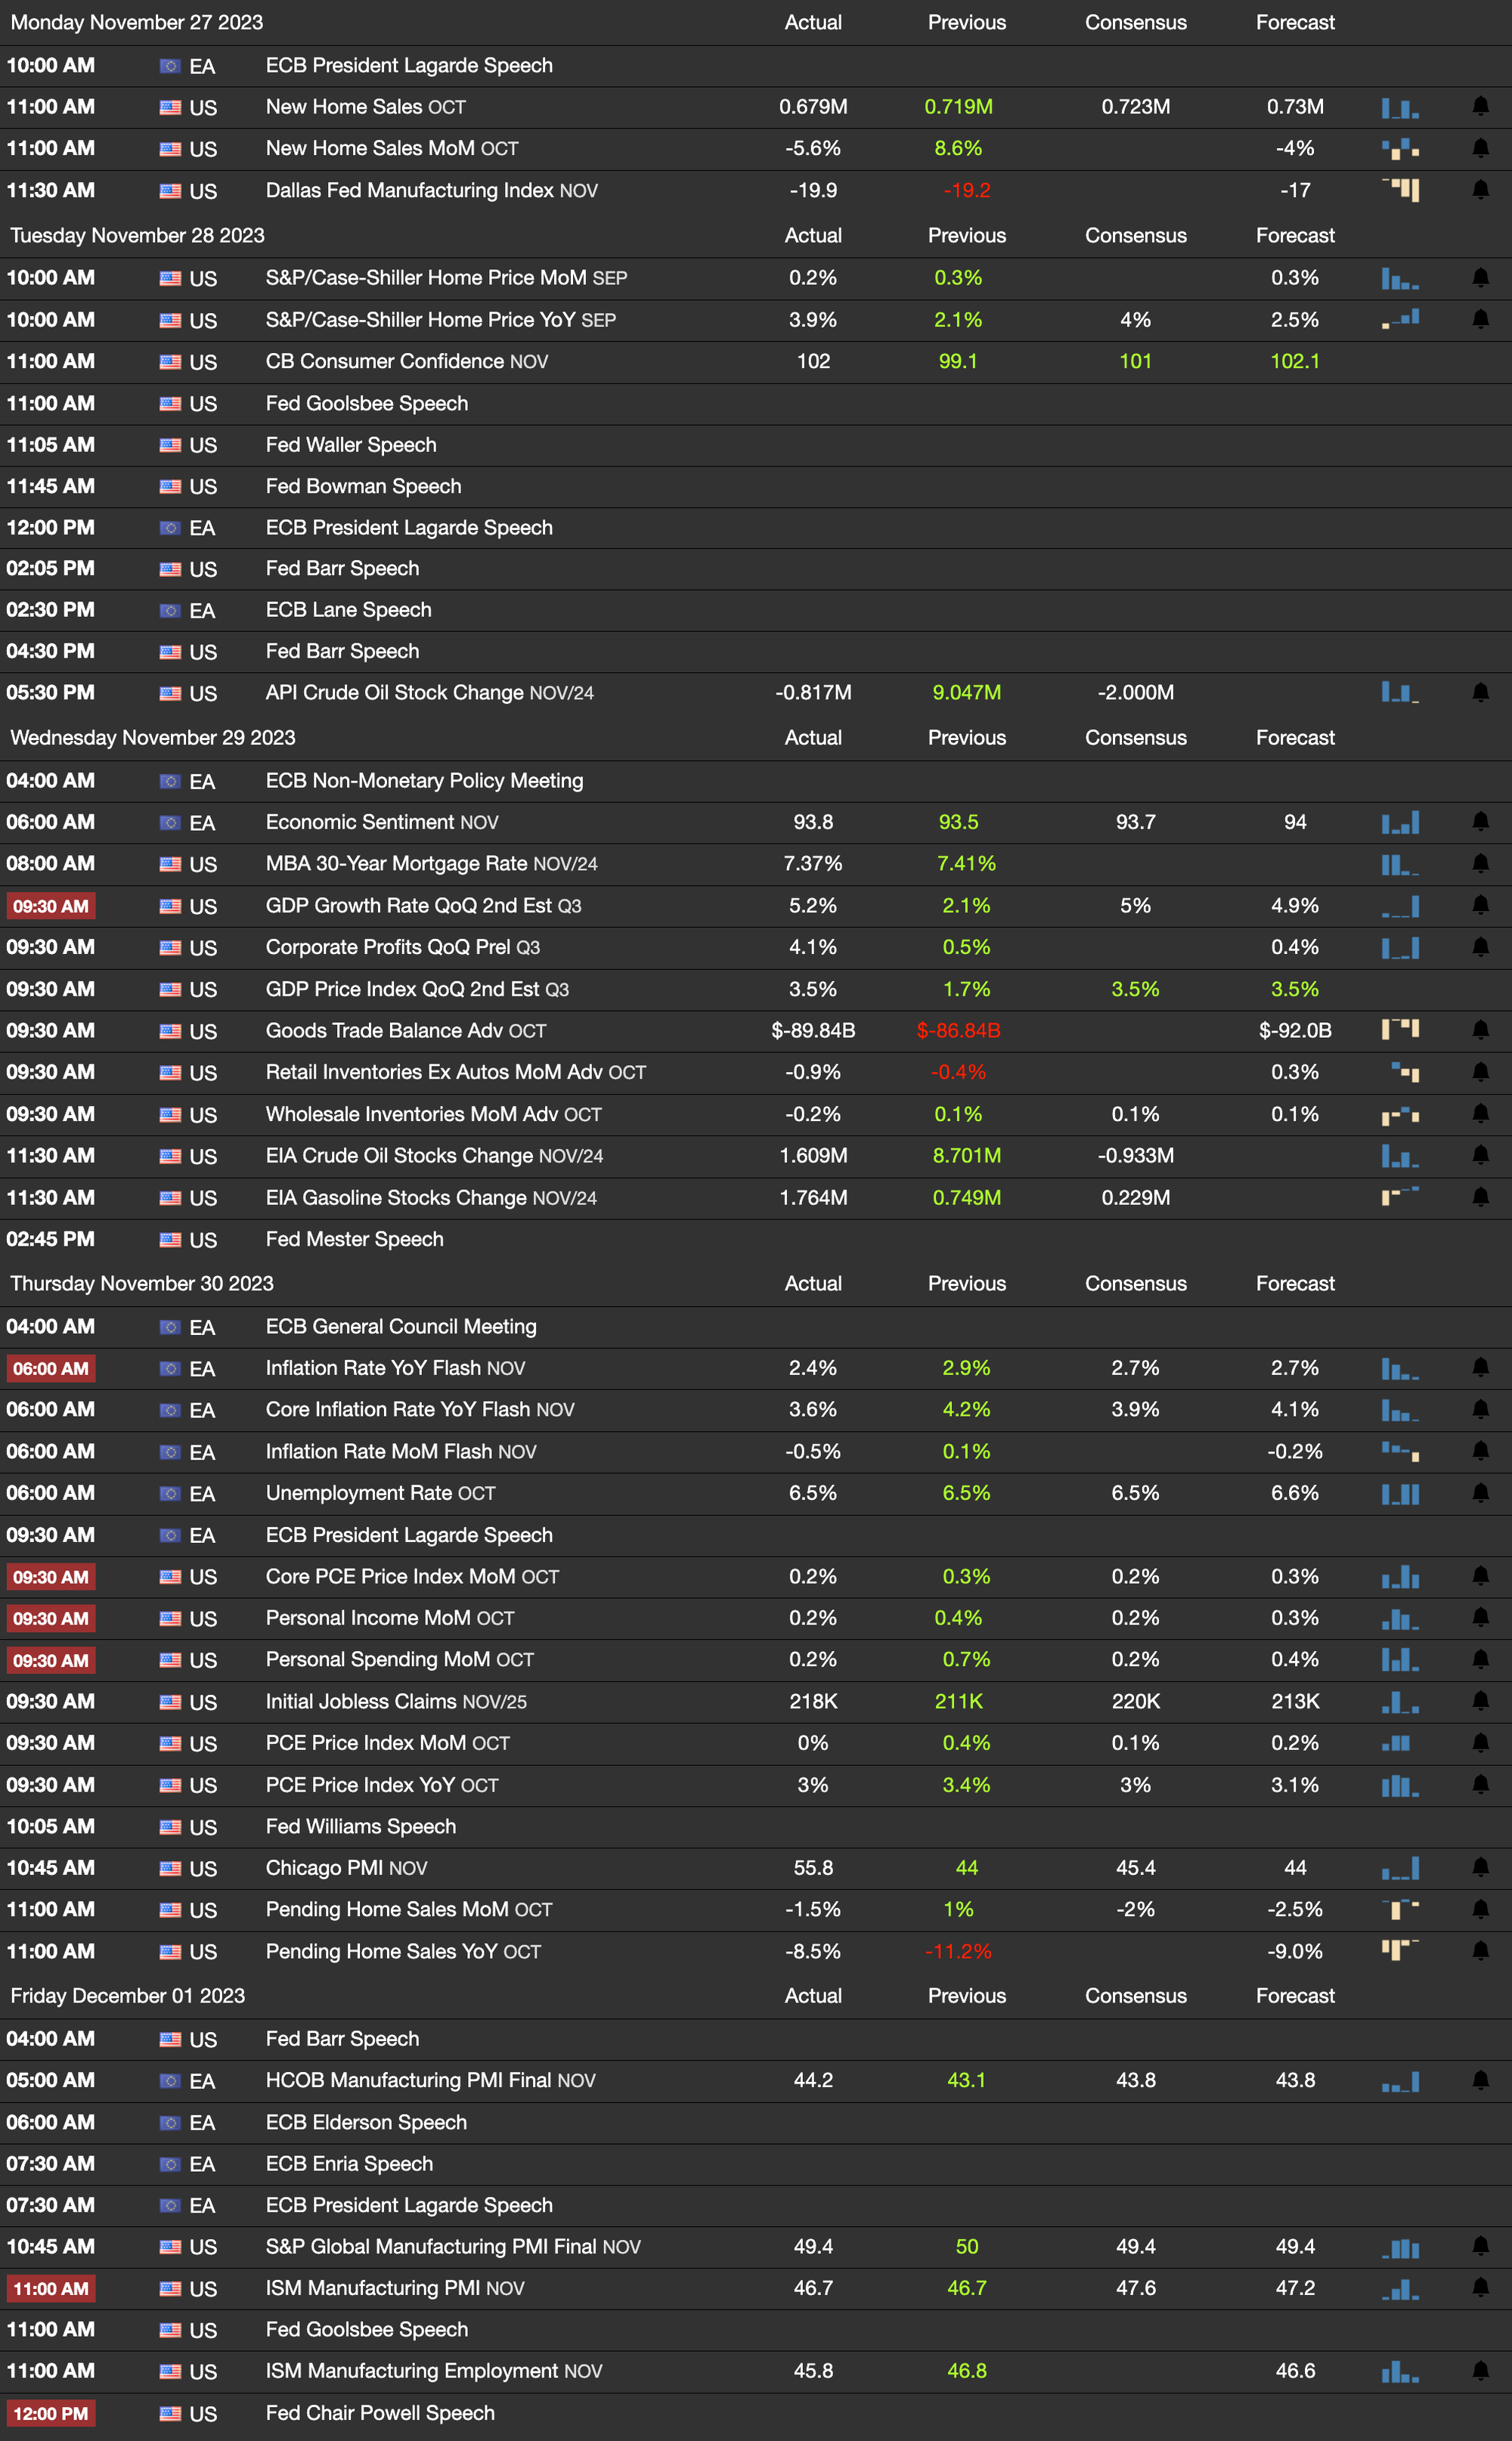
Week Ahead
It is anticipated that PCE price inflation slowed to 3.1% last month, marking the lowest rate since March 2021. The core rate is expected to ease to 3.5%, the lowest in over two years. Additionally, US GDP growth is expected to be revised higher to 5% from the initial 4.9%. This can be attributed to accelerated consumer spending and robust exports.
The ISM data is expected to indicate a continued contraction in the manufacturing sector. Furthermore, insights into the US central bank's policy direction will be sought from speeches by several Federal Reserve policymakers, including Chair Powell's remarks scheduled for Friday.
Other important data to watch includes new and pending home sales, Case-Shiller home prices, and advance estimates of the goods trade balance and wholesale inventories. Additionally, the earnings season will continue with expected results from Intuit, CrowdStrike, Workday, Snowflake, Synopsys, Salesforce, VMware, and Dell - Trading Economics
Earnings
| Metric | UpDn | This Week | Prior Week | Baseline | Baseline TF |
|---|---|---|---|---|---|
Forward 4-qtr Estimate | 🔴 | 235.82 | 235.95 | 228.39 | January 1, 2023 |
Forward 4-qtr PE | 🔵 | 19.3 | 19.1 | 17.2 | January 1, 2023 |
Nominal Earnings Yield | 🔴 | 5.17 | 5.23 | 5.86 | January 1, 2023 |
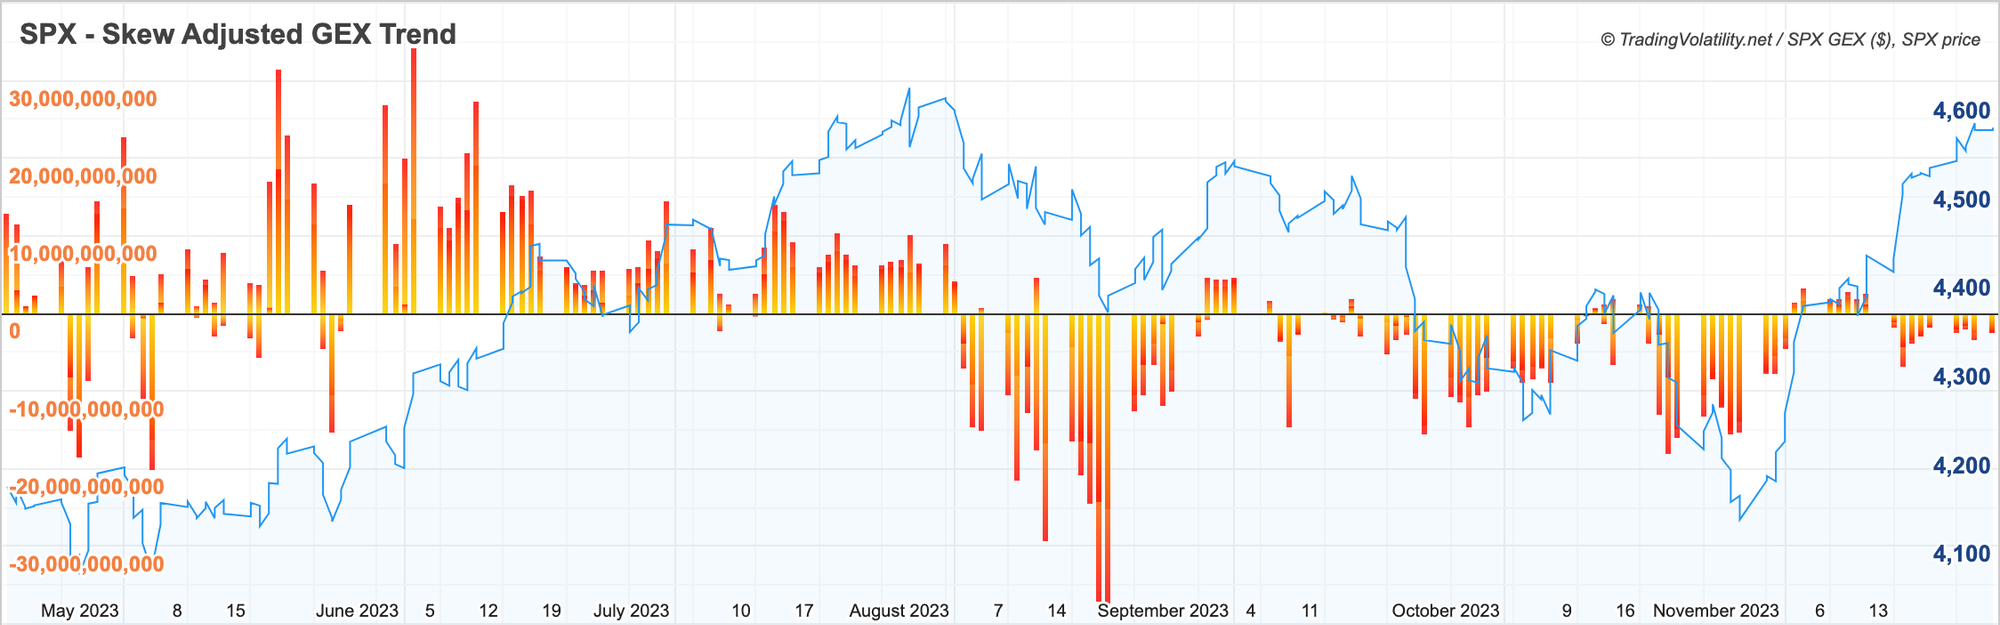
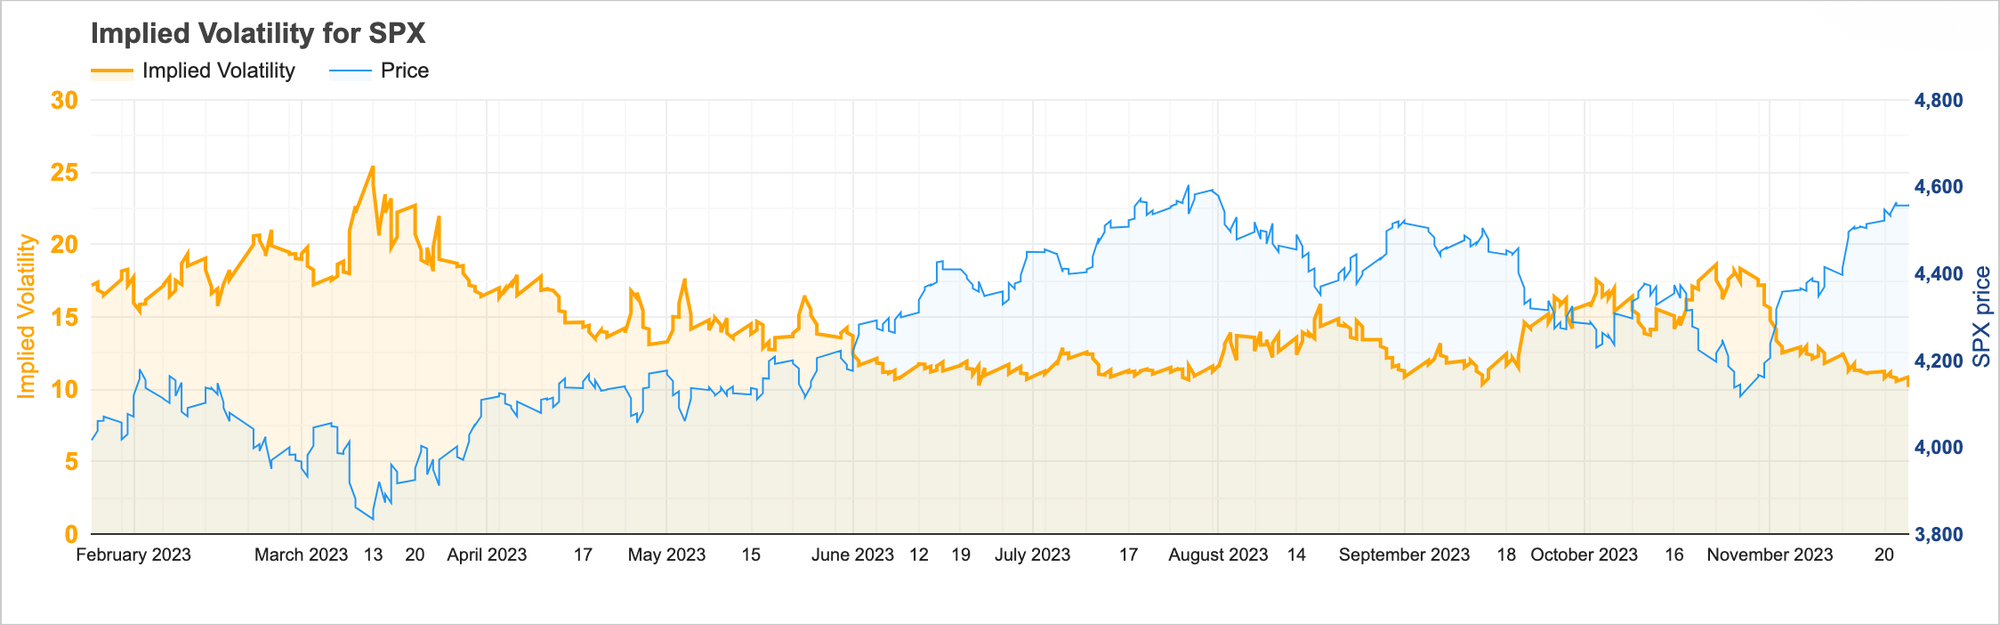
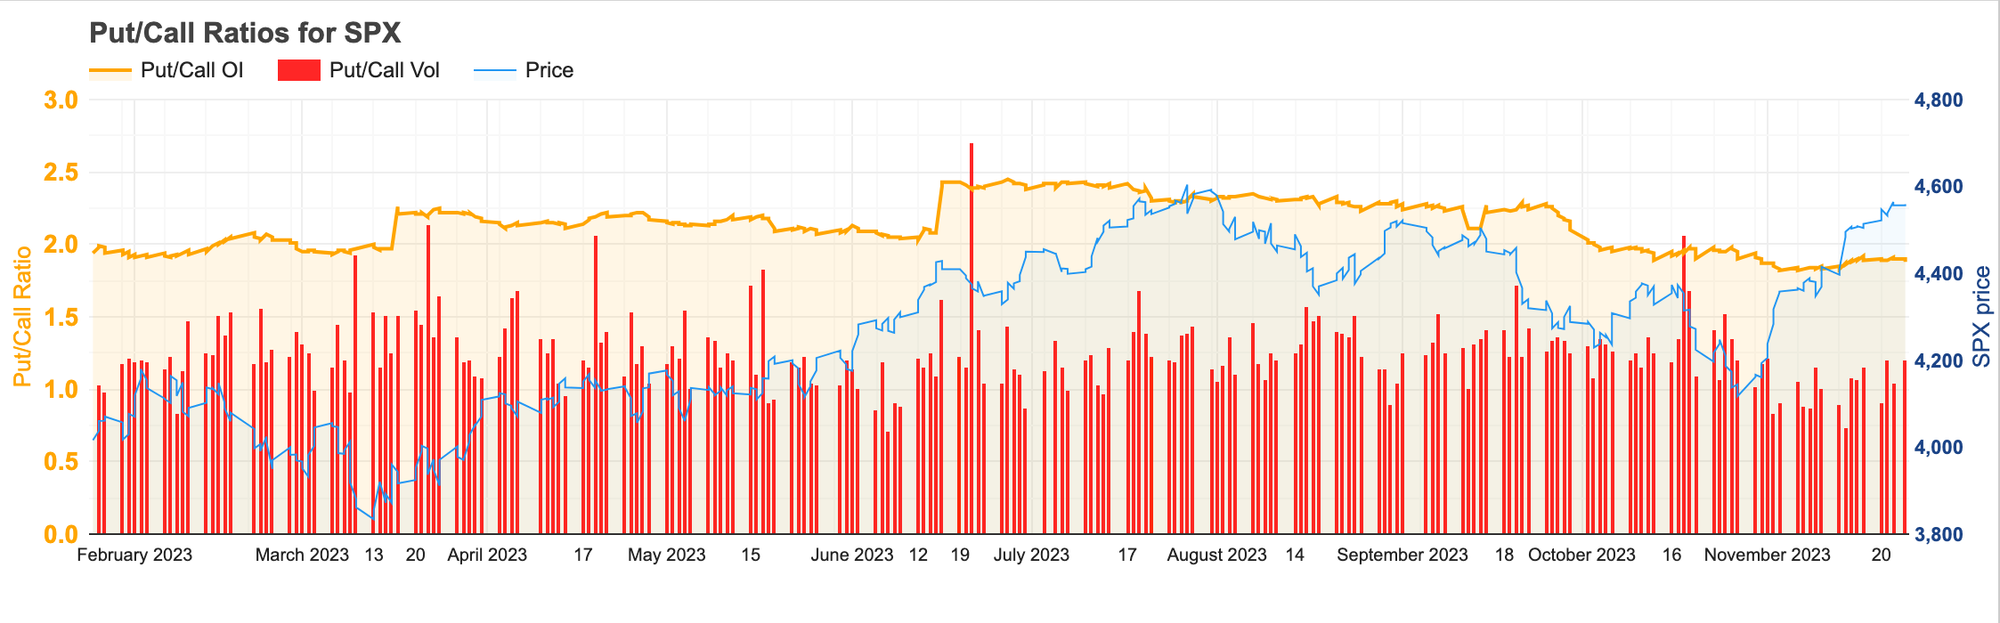
Options
| Metric | UpDn | This Week | Prior Week | Net CHG | % CHG |
|---|---|---|---|---|---|
SPX Implied Volatility | 🔴 | 10.16 | 11.14 | -0.98 | -8.8% |
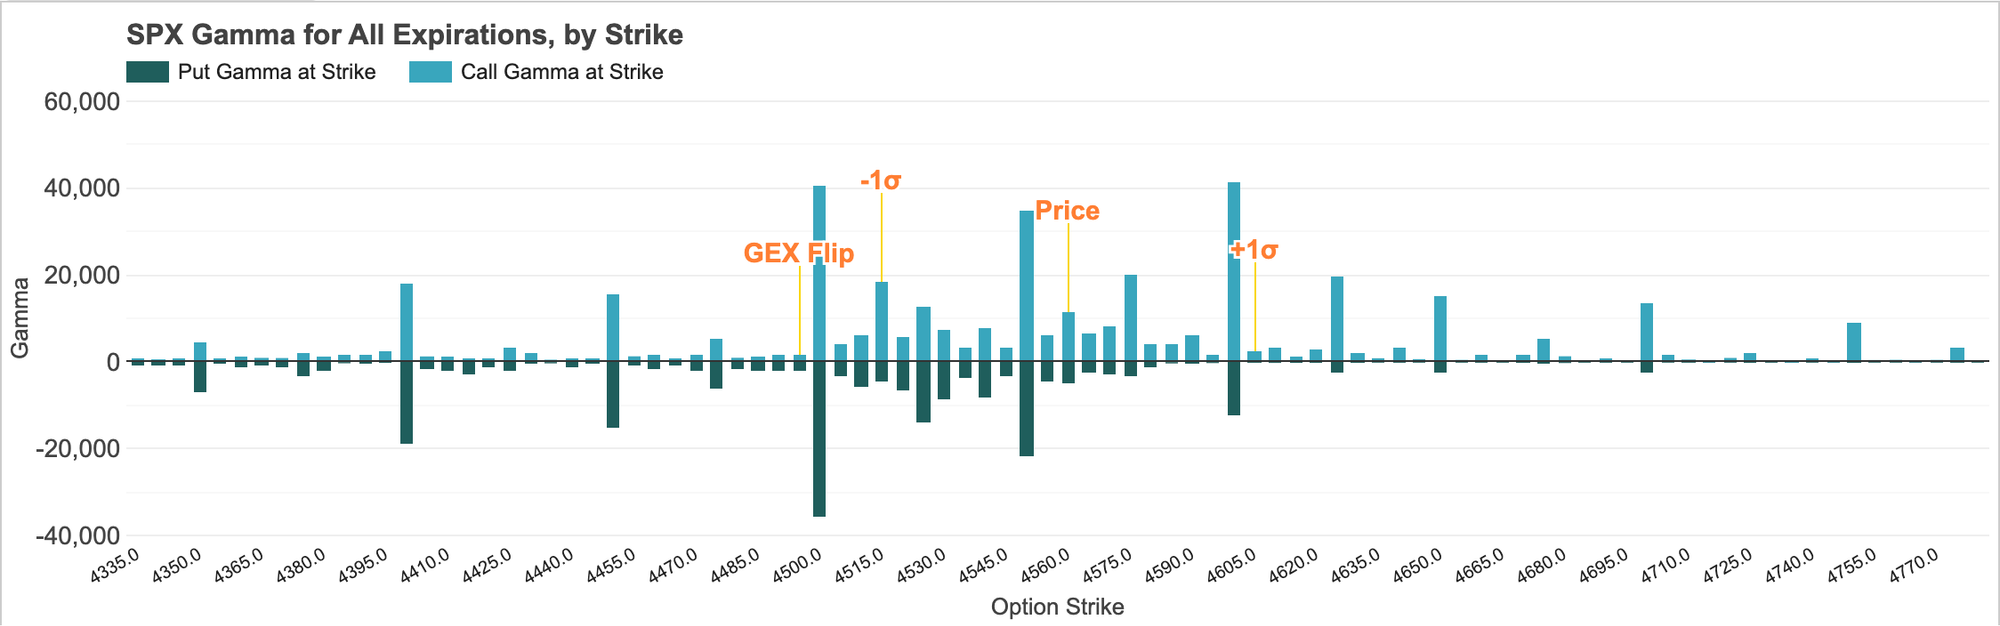
SPX GEX Flip | 🔵 | 4,497.5 | 4,442.5 | 55 | 1.24% |
SPX Skew Adjusted GEX | 🔴 | -2,534,779,228 | -1,963,747,224 | -571,032,004 | -29.08% |
Equity Put/Call Ratio (CBOE) | 🔵 | 0.91 | 0.54 | 0.37 | 68.52% |
VIX Put/Call Ratio (CBOE) | 🔵 | 0.46 | 0.41 | 0.05 | 12.2% |
SPX/W Put/Call Ratio (CBOE) | 🔵 | 1.83 | 1.46 | 0.37 | 25.34% |
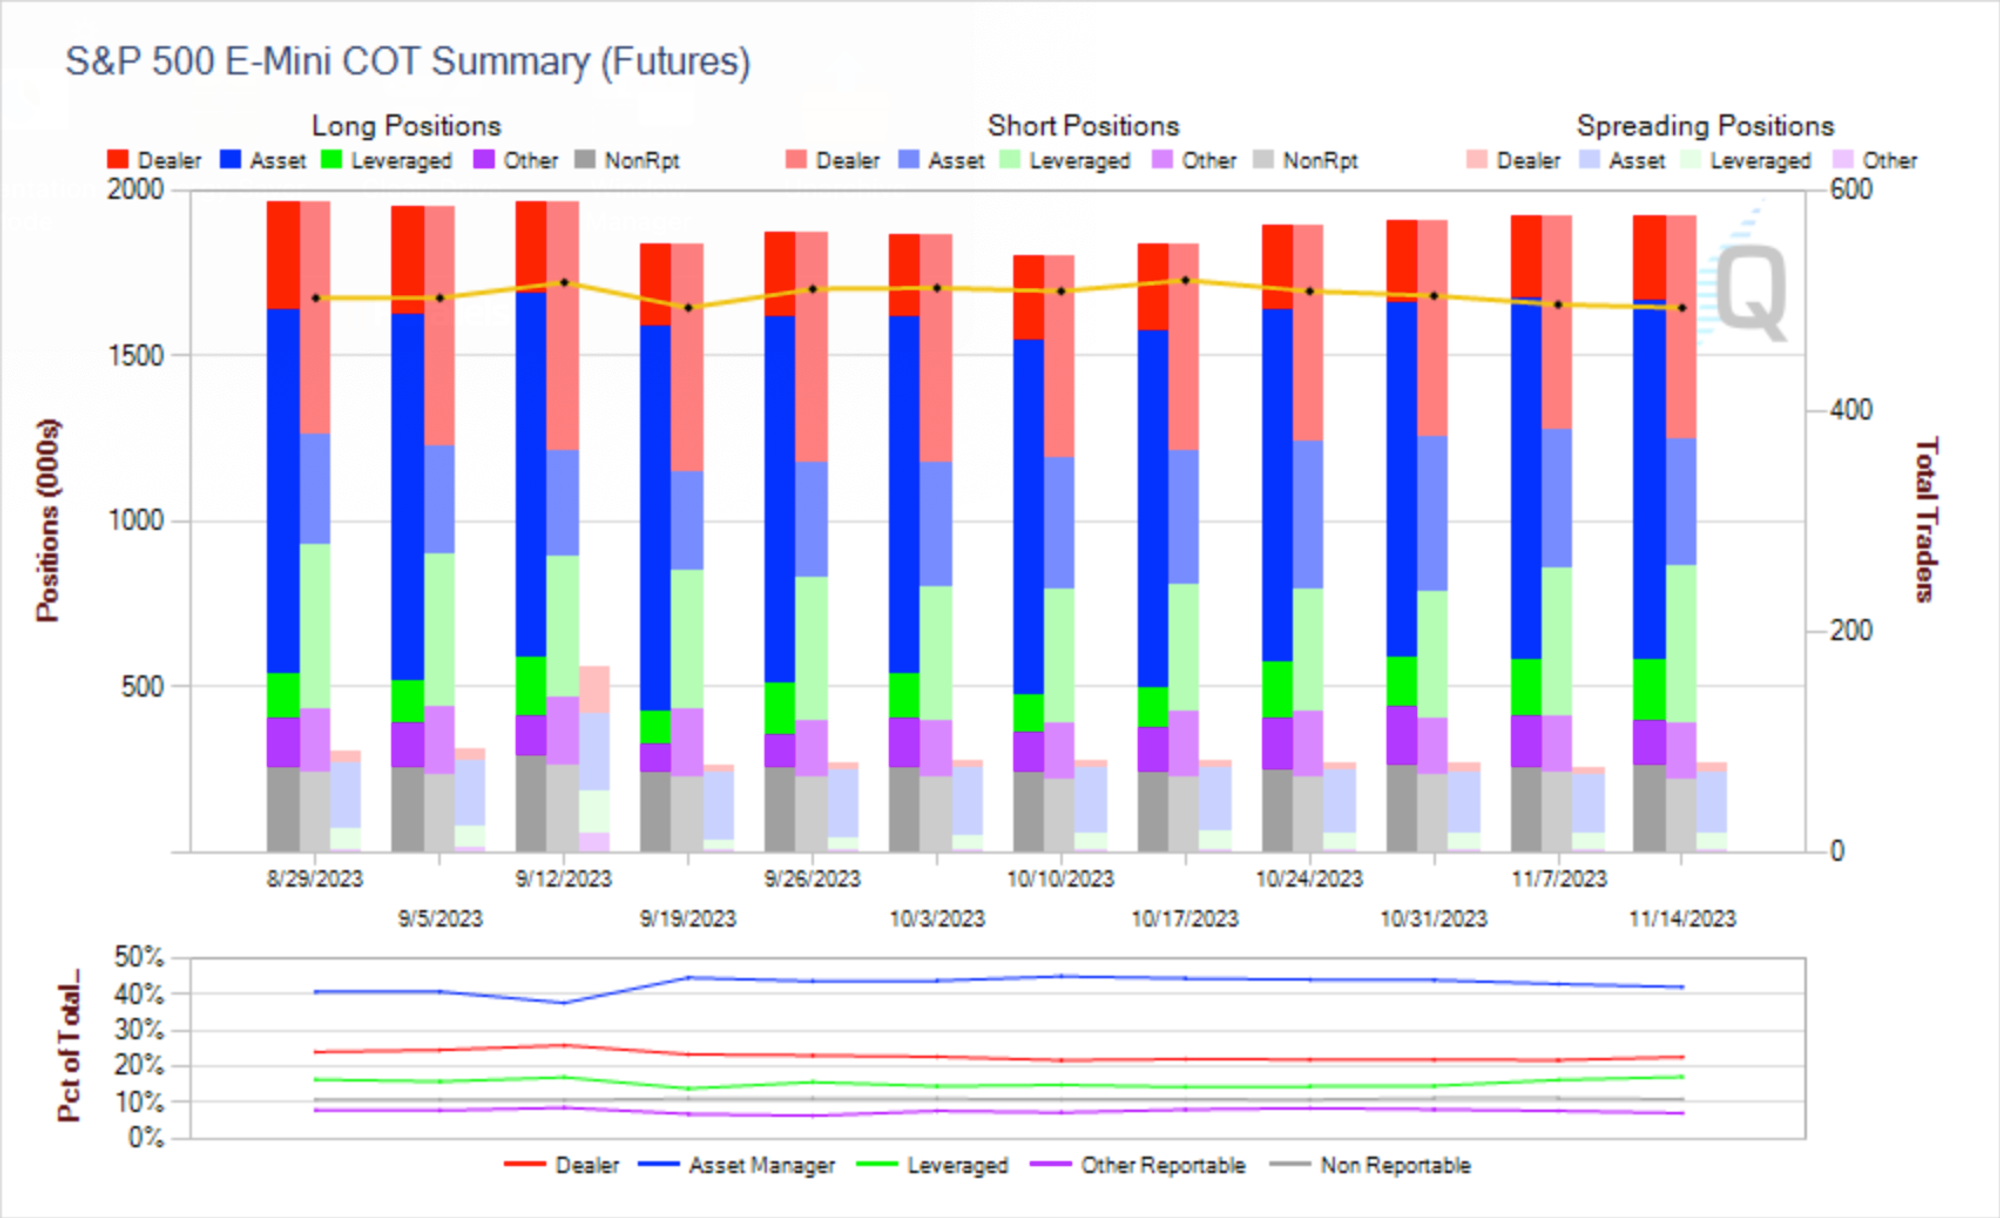
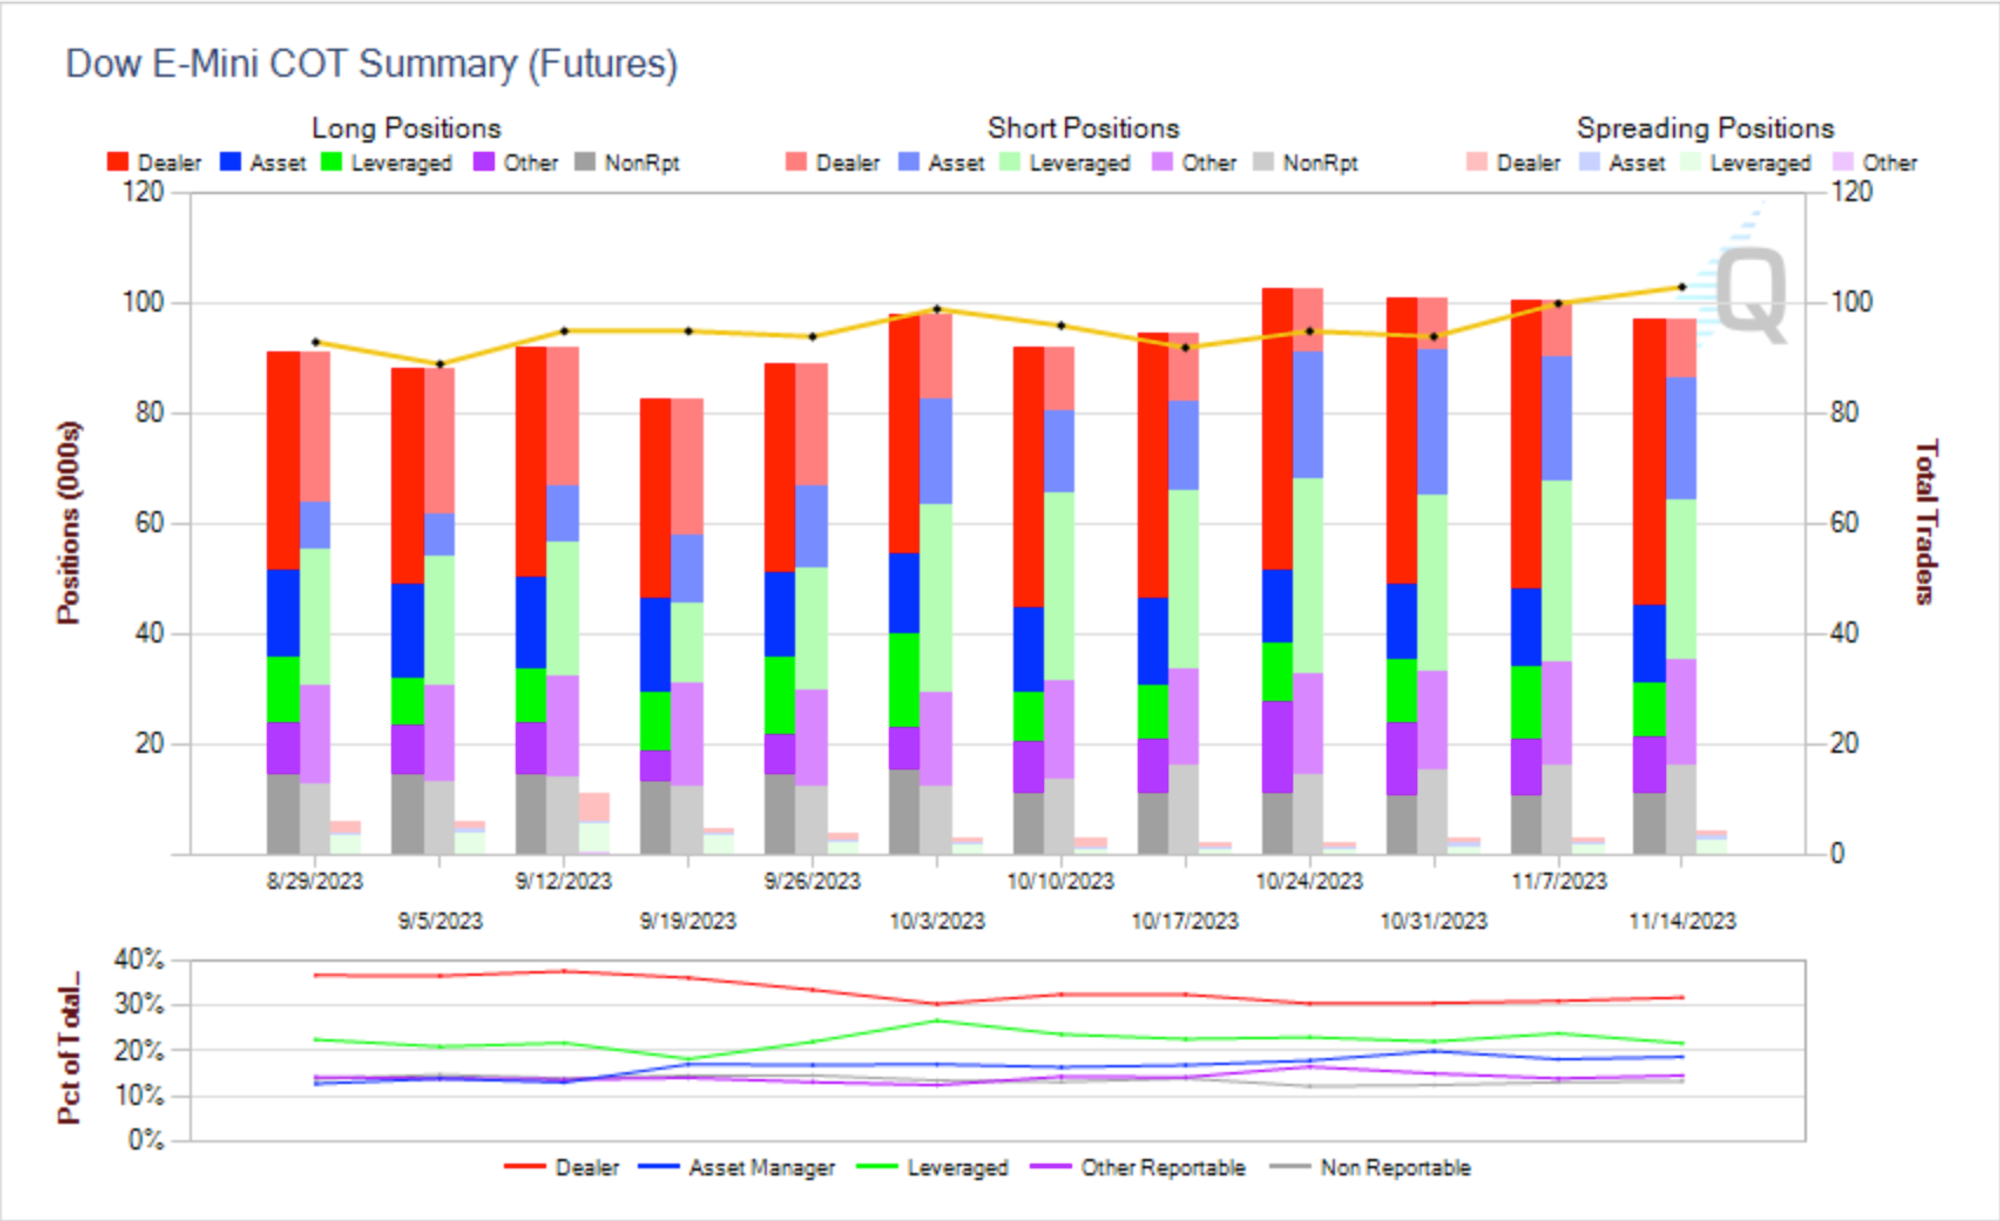
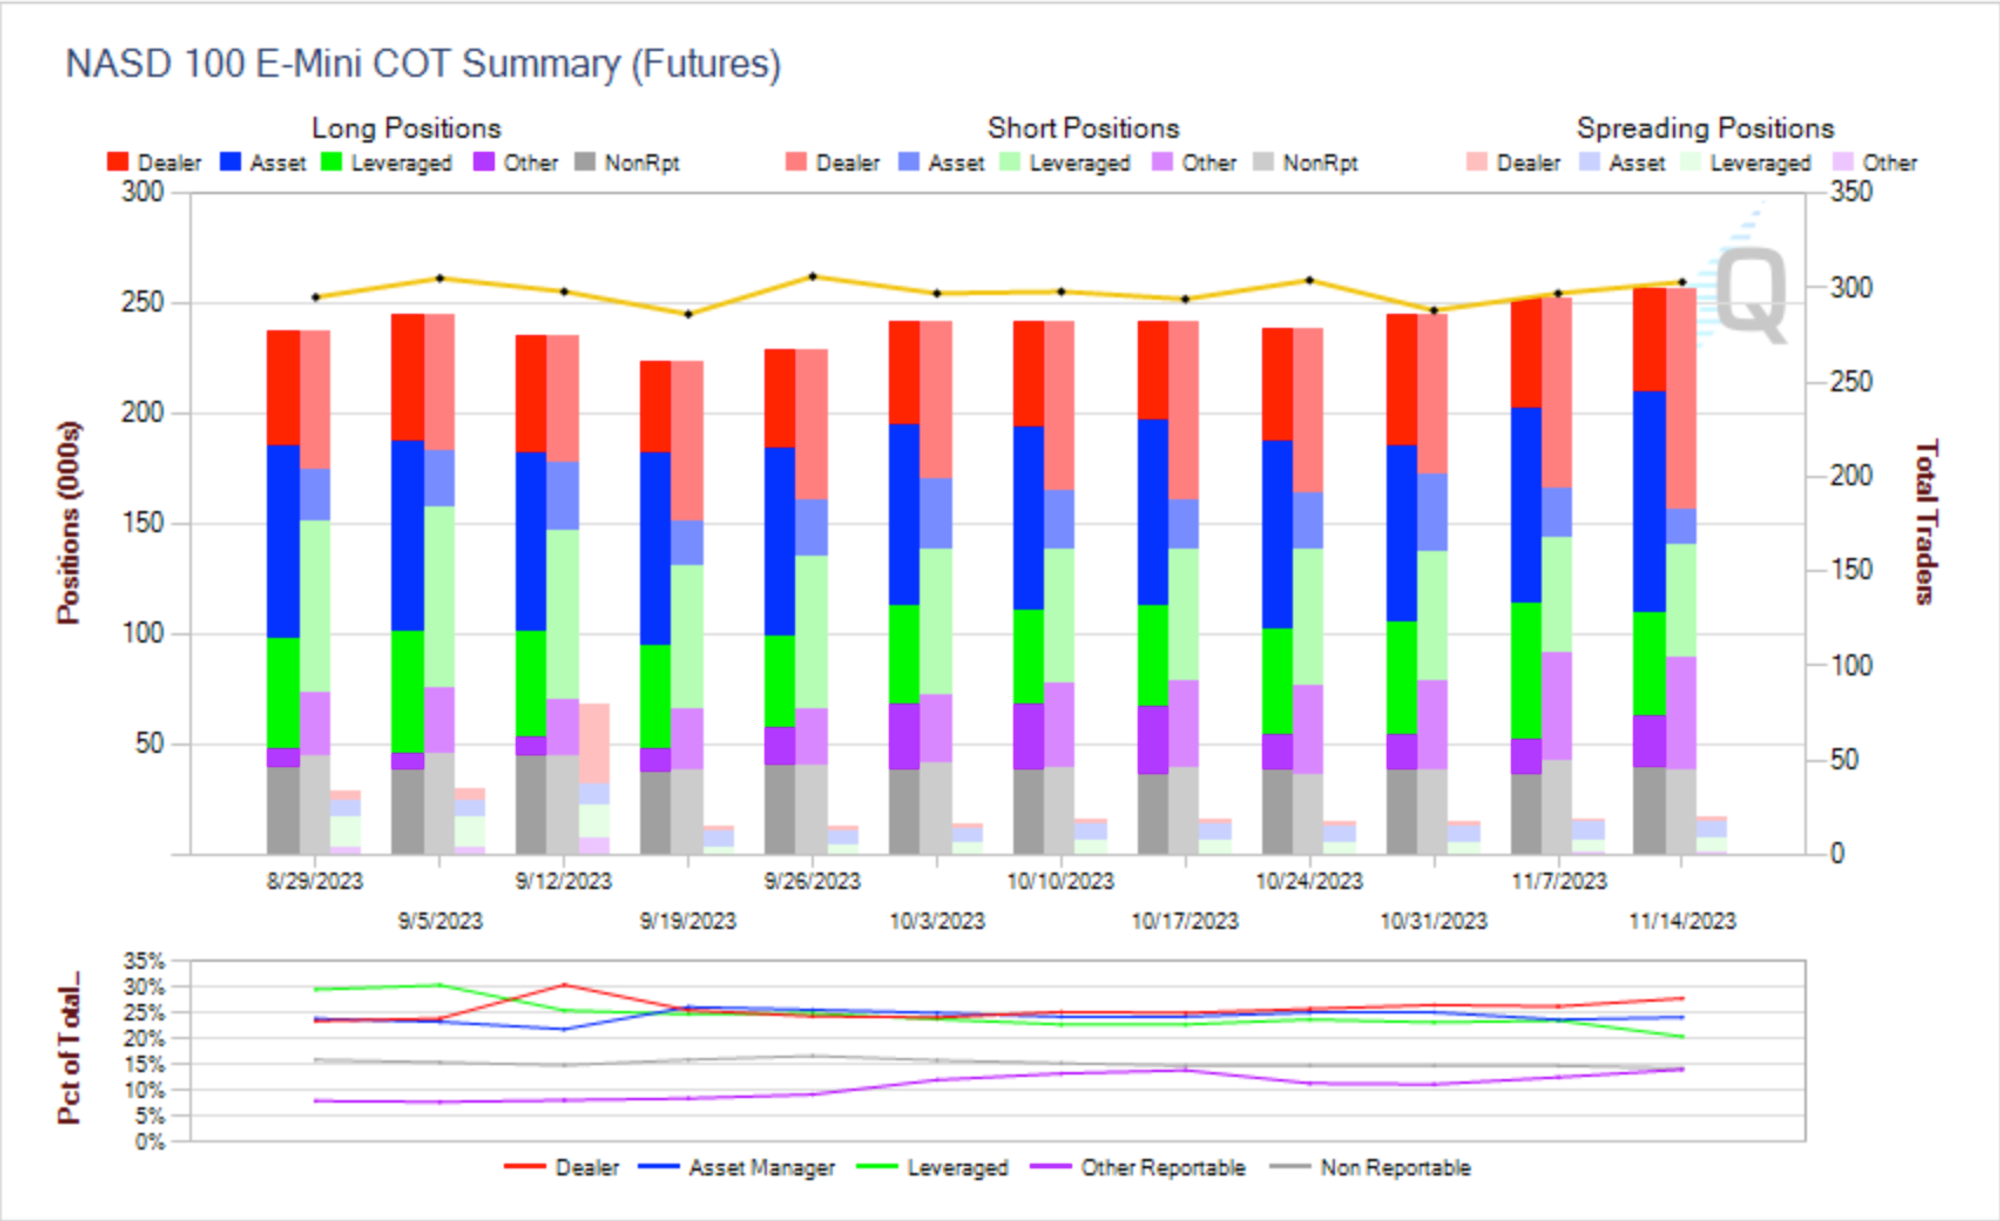
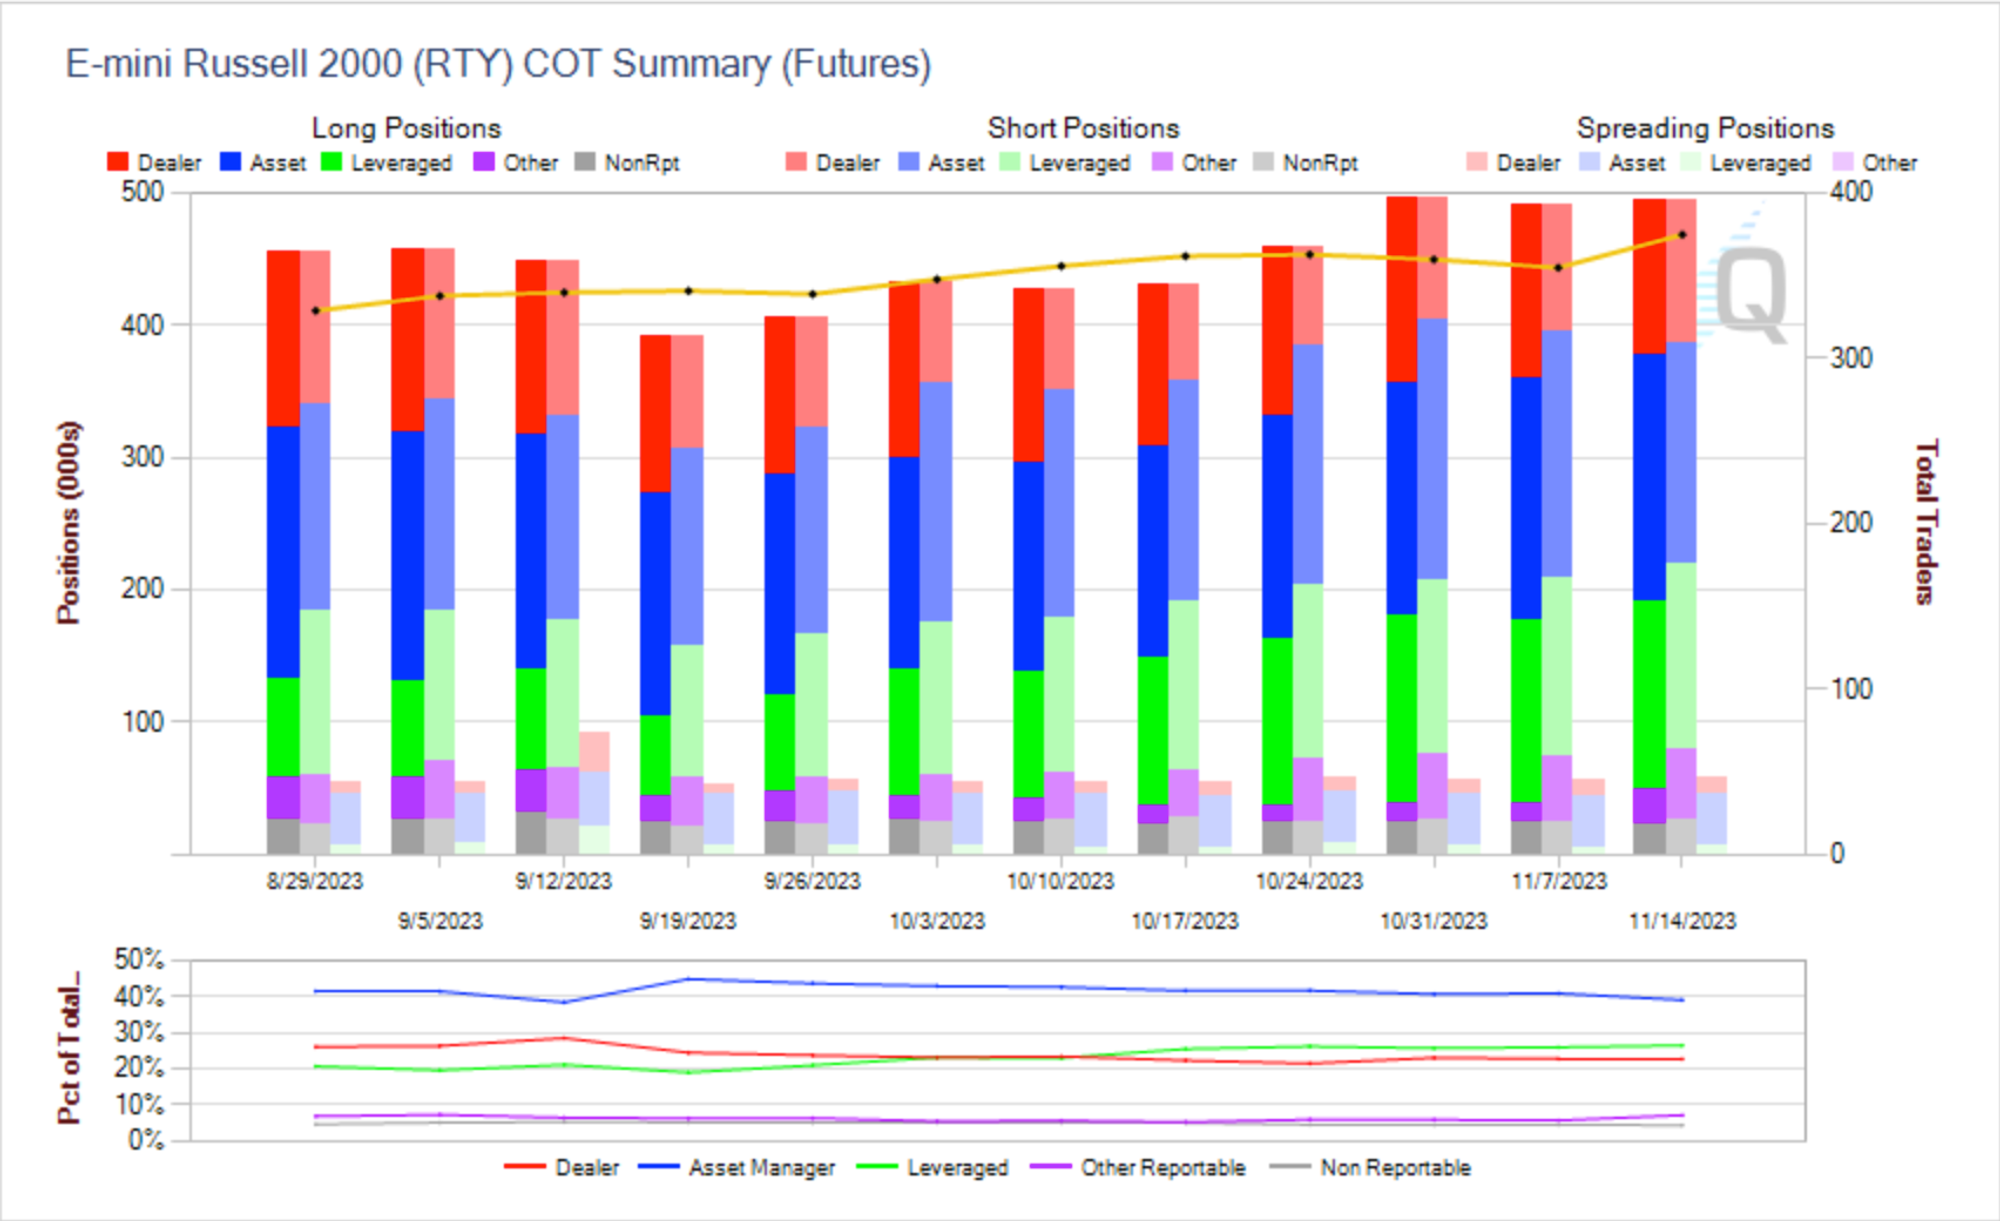
Futures
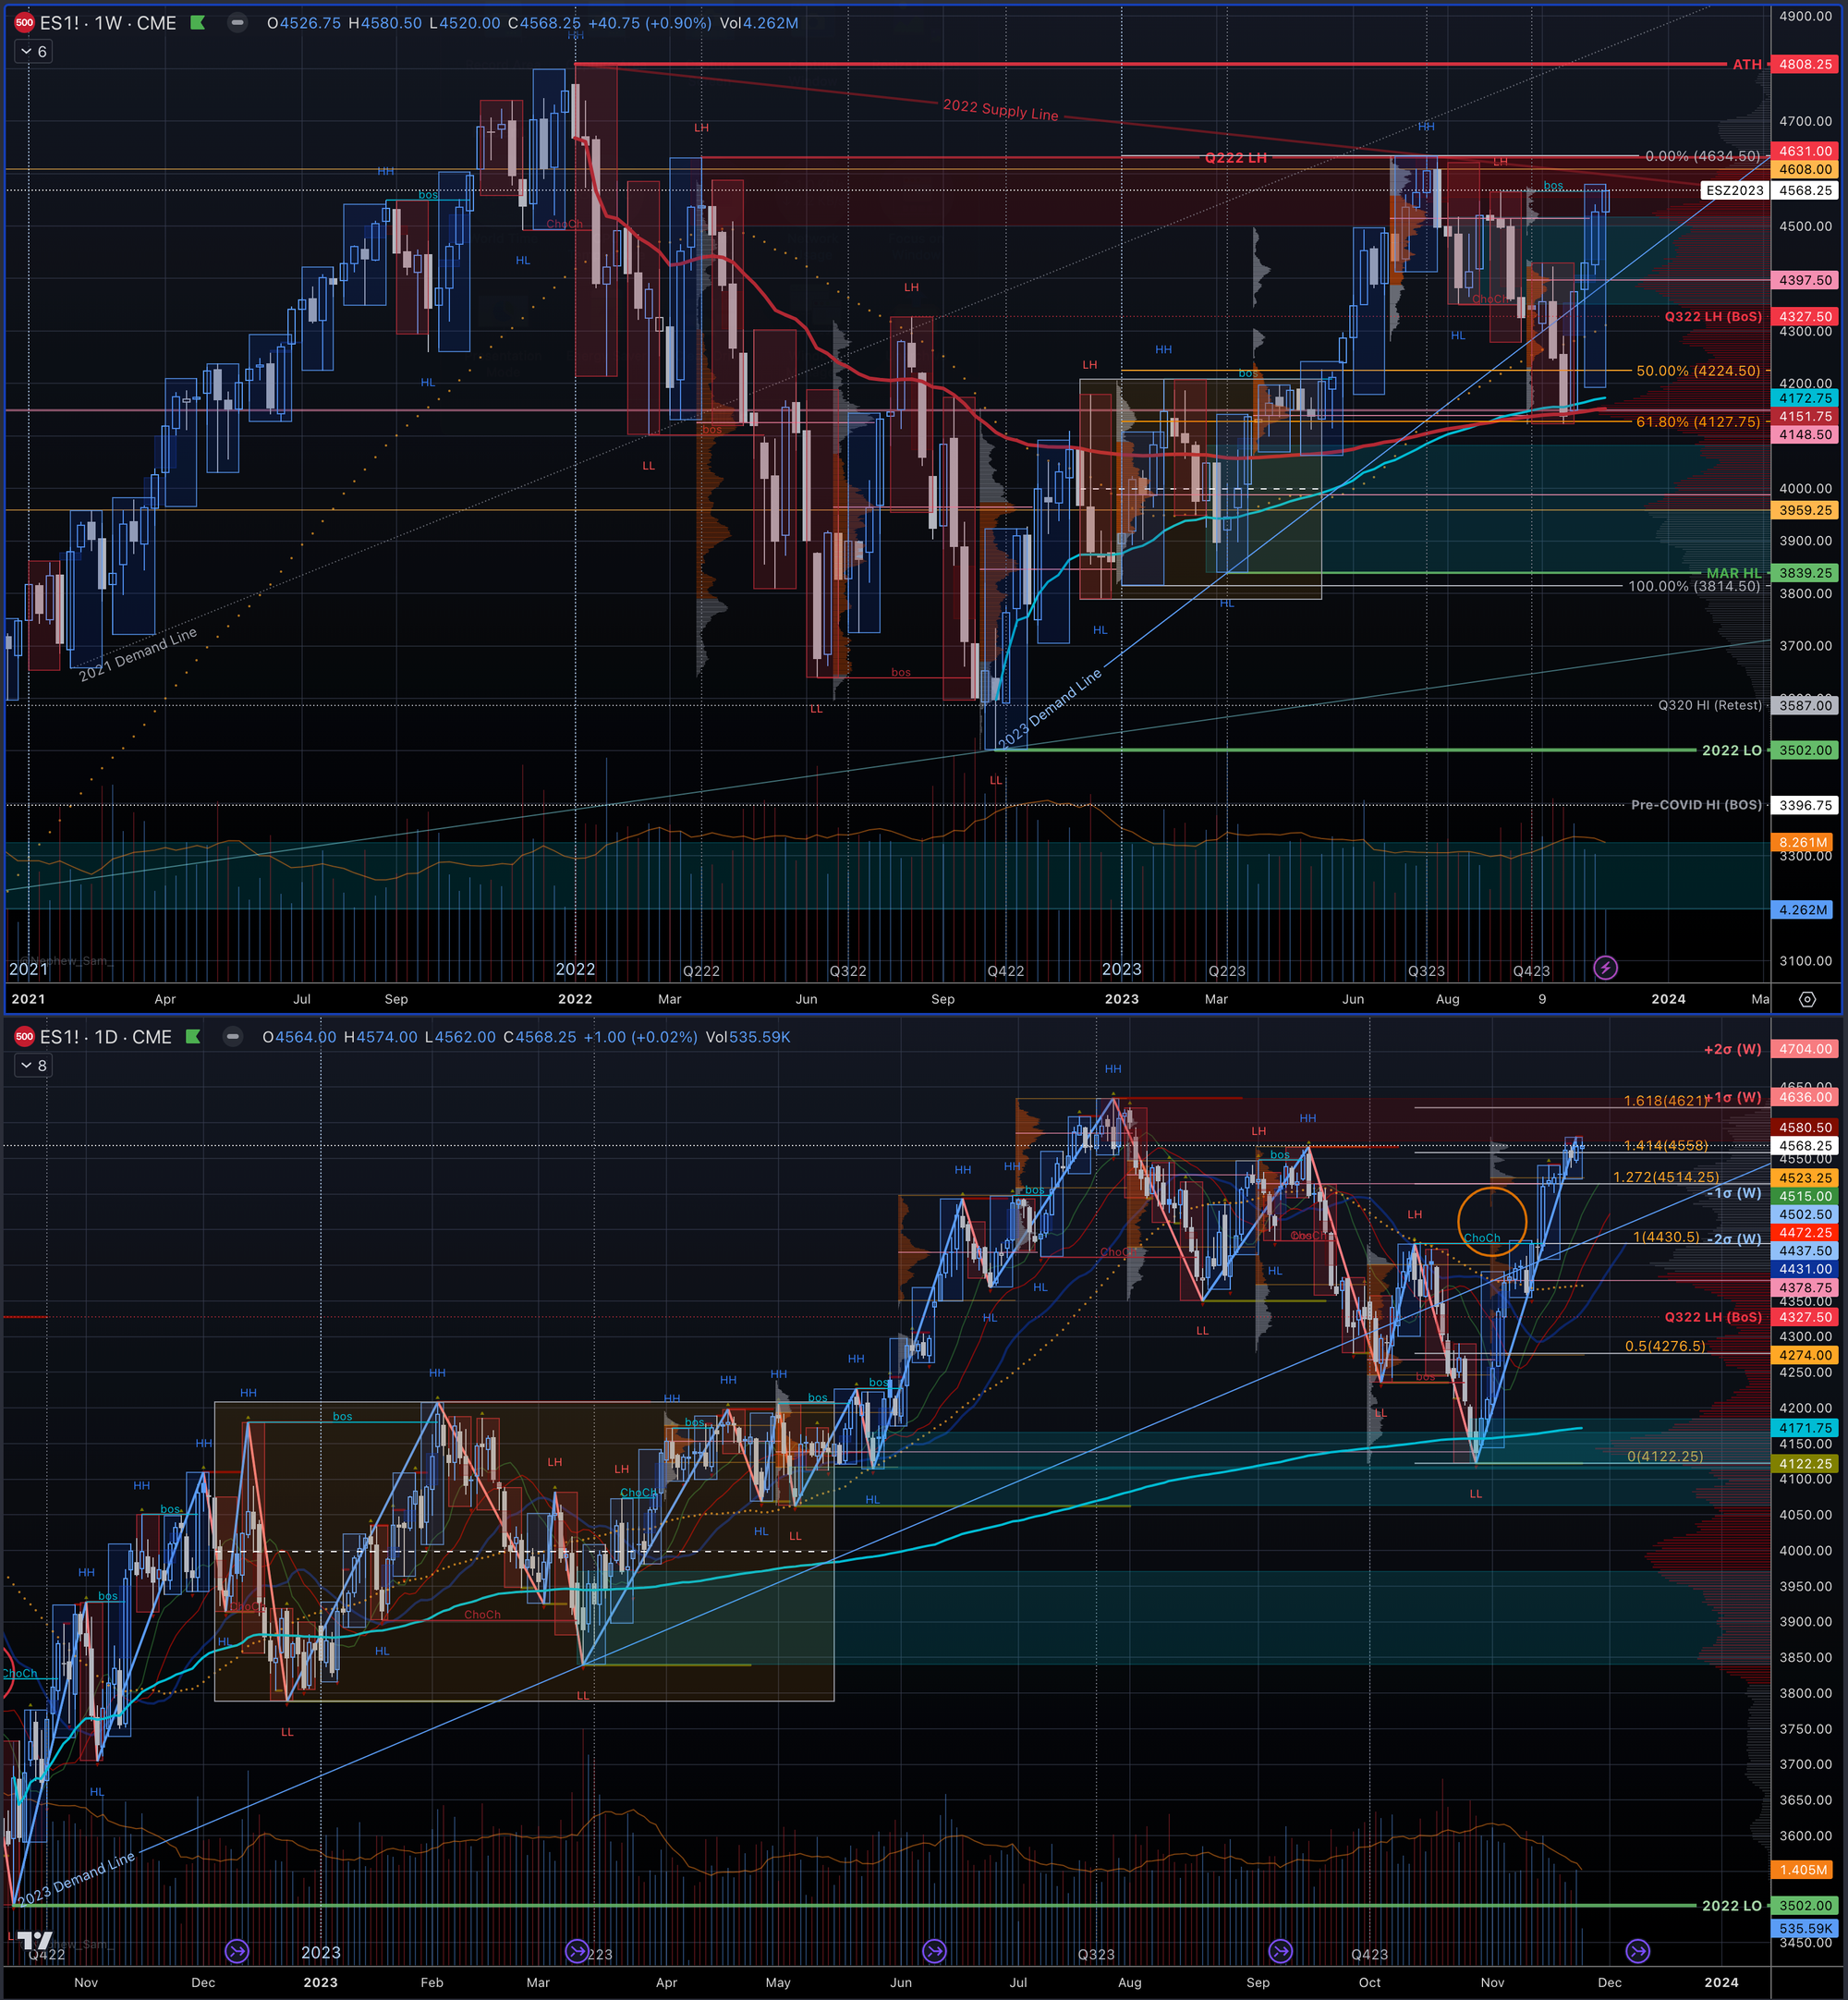
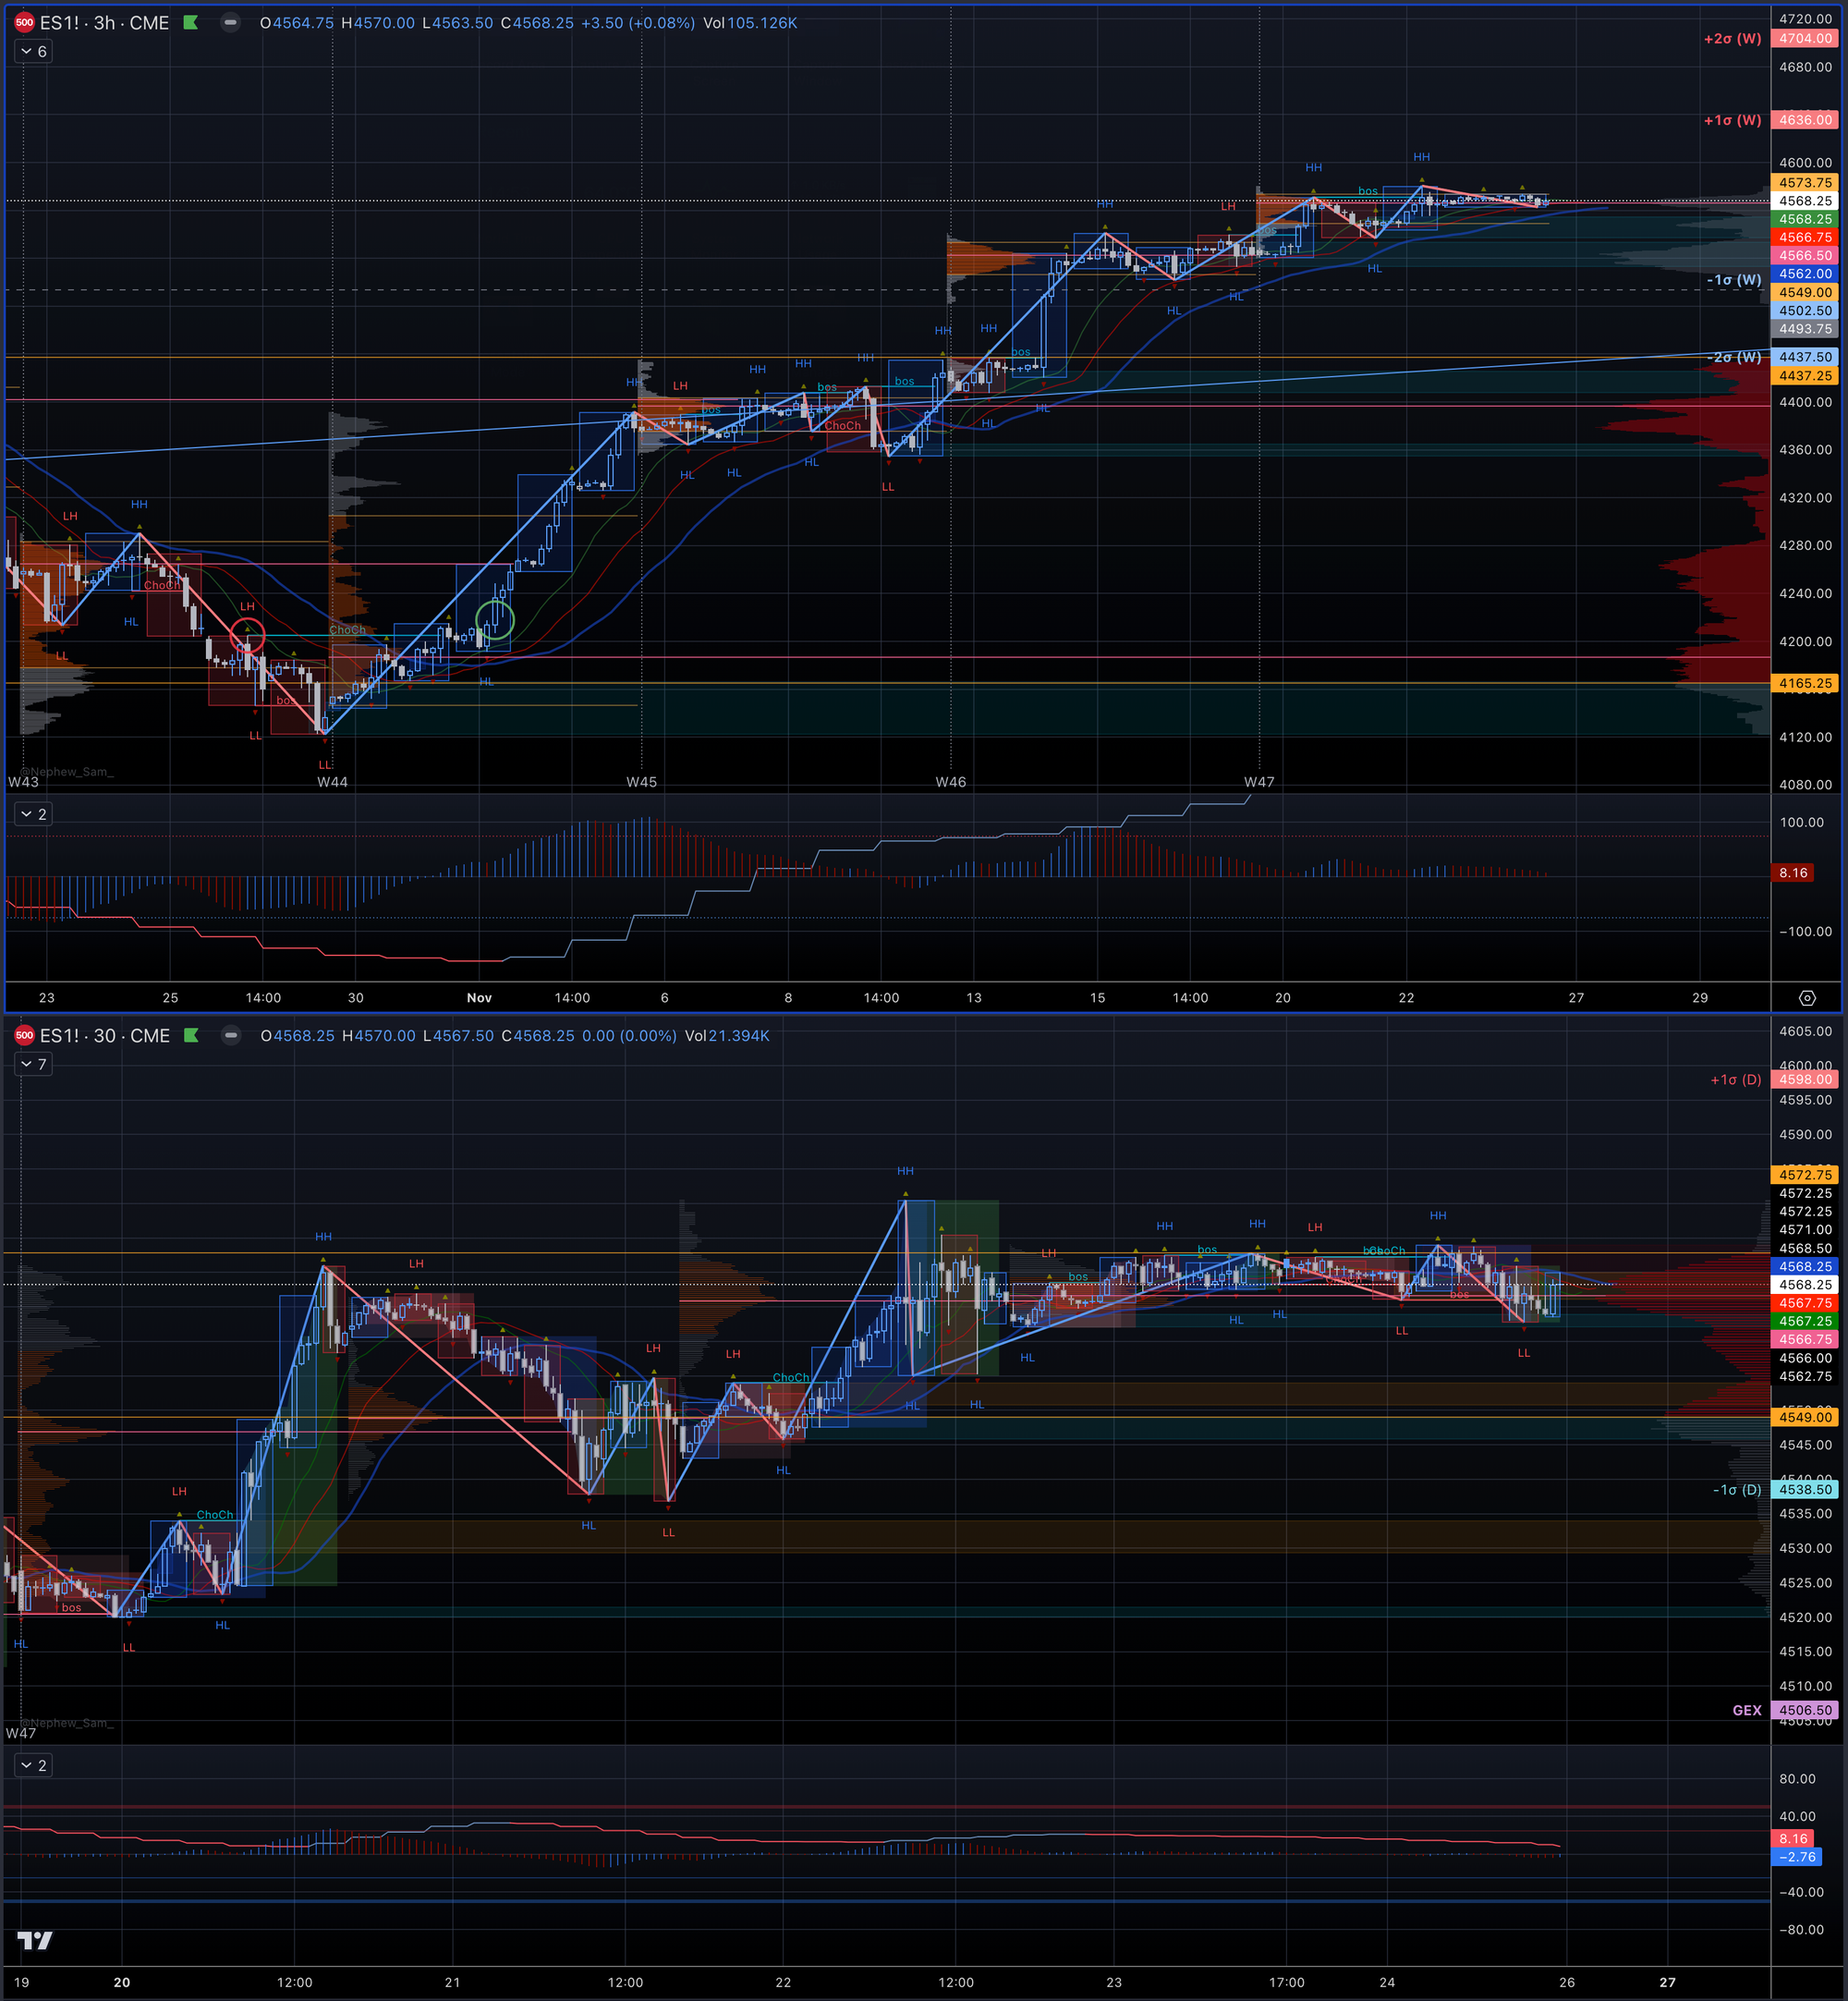
Bull v Bear
This Week (30d ATM IV 10.11% v 30d RVOL 14.94%)
.png?id=d2405c41-28db-4282-afca-d90d86c1aaa2&table=block)

Last Week (4568.25 DEC23 +0.89%)Bears will seek to cause cessation of DTF 1TFU. Downside: Negative GEX < 4454.00 coincides with -1σ (W) 4455 (-1.62%); 4430.50 breakout backtest (-2.14%).
.png?id=641249f3-474a-4f42-a116-7301563a7f56&table=block)
.png?id=c1a2e5bd-6aad-41a6-826c-dea7a5708f78&table=block)
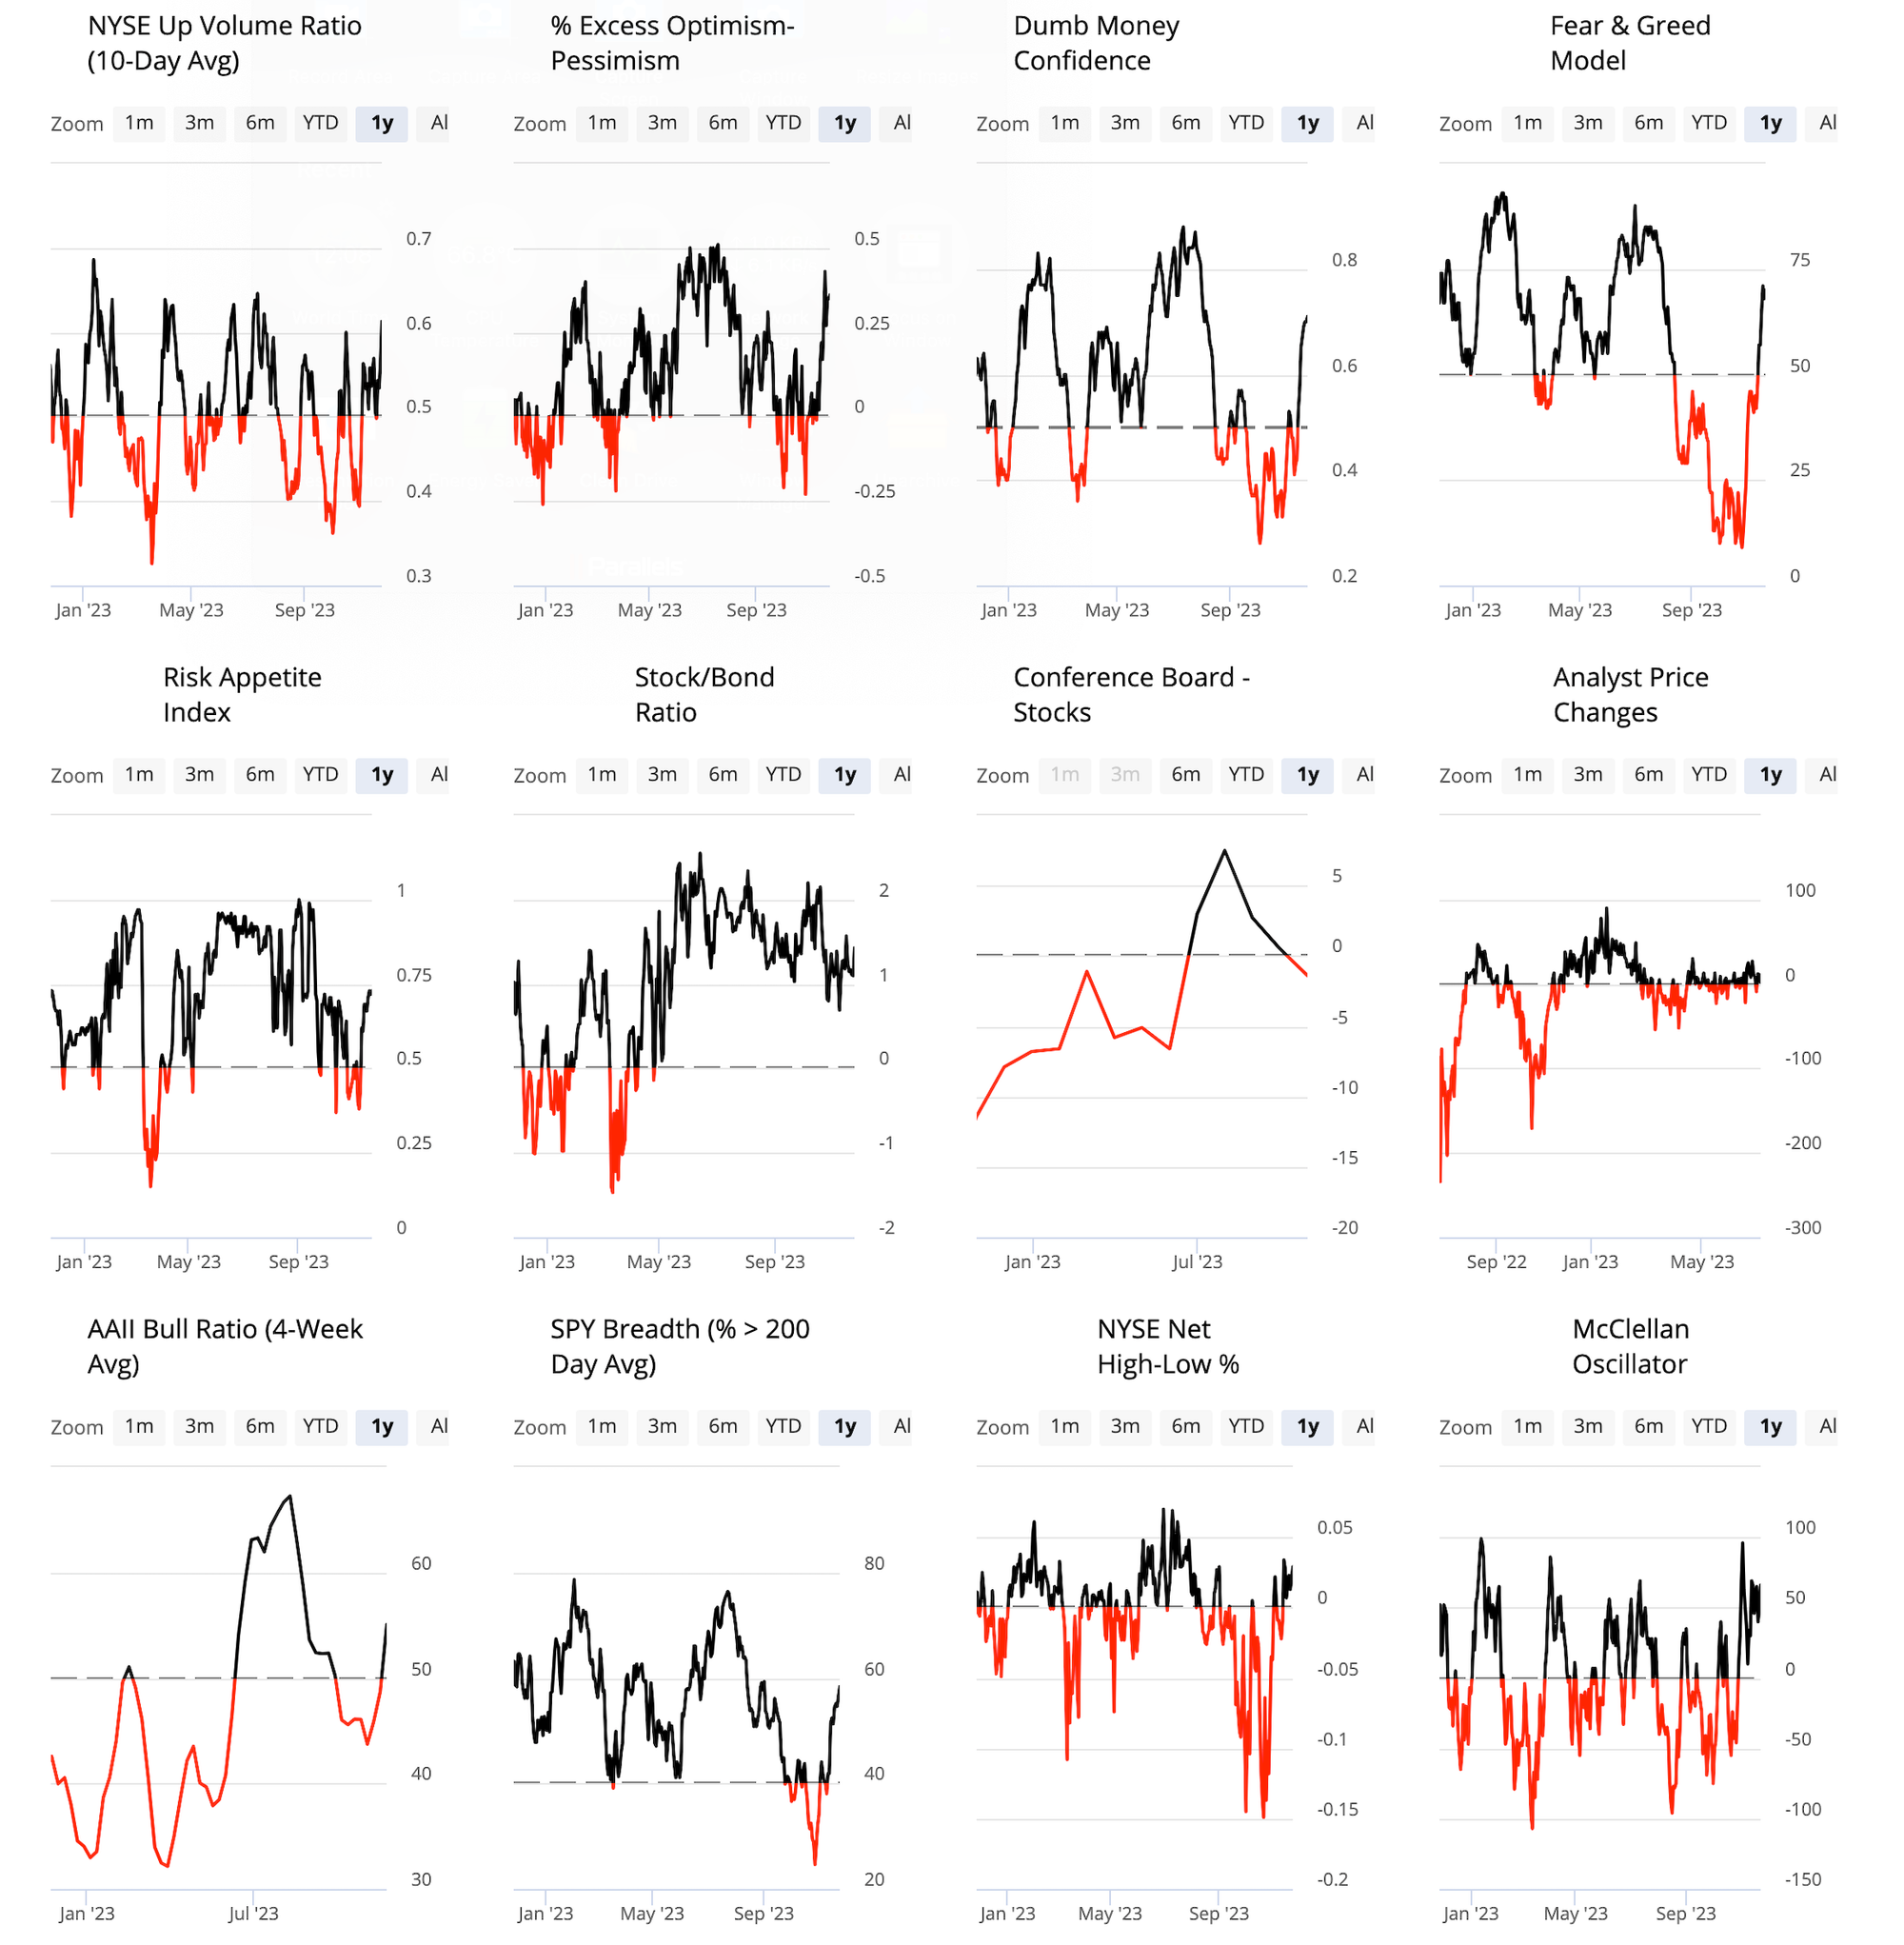
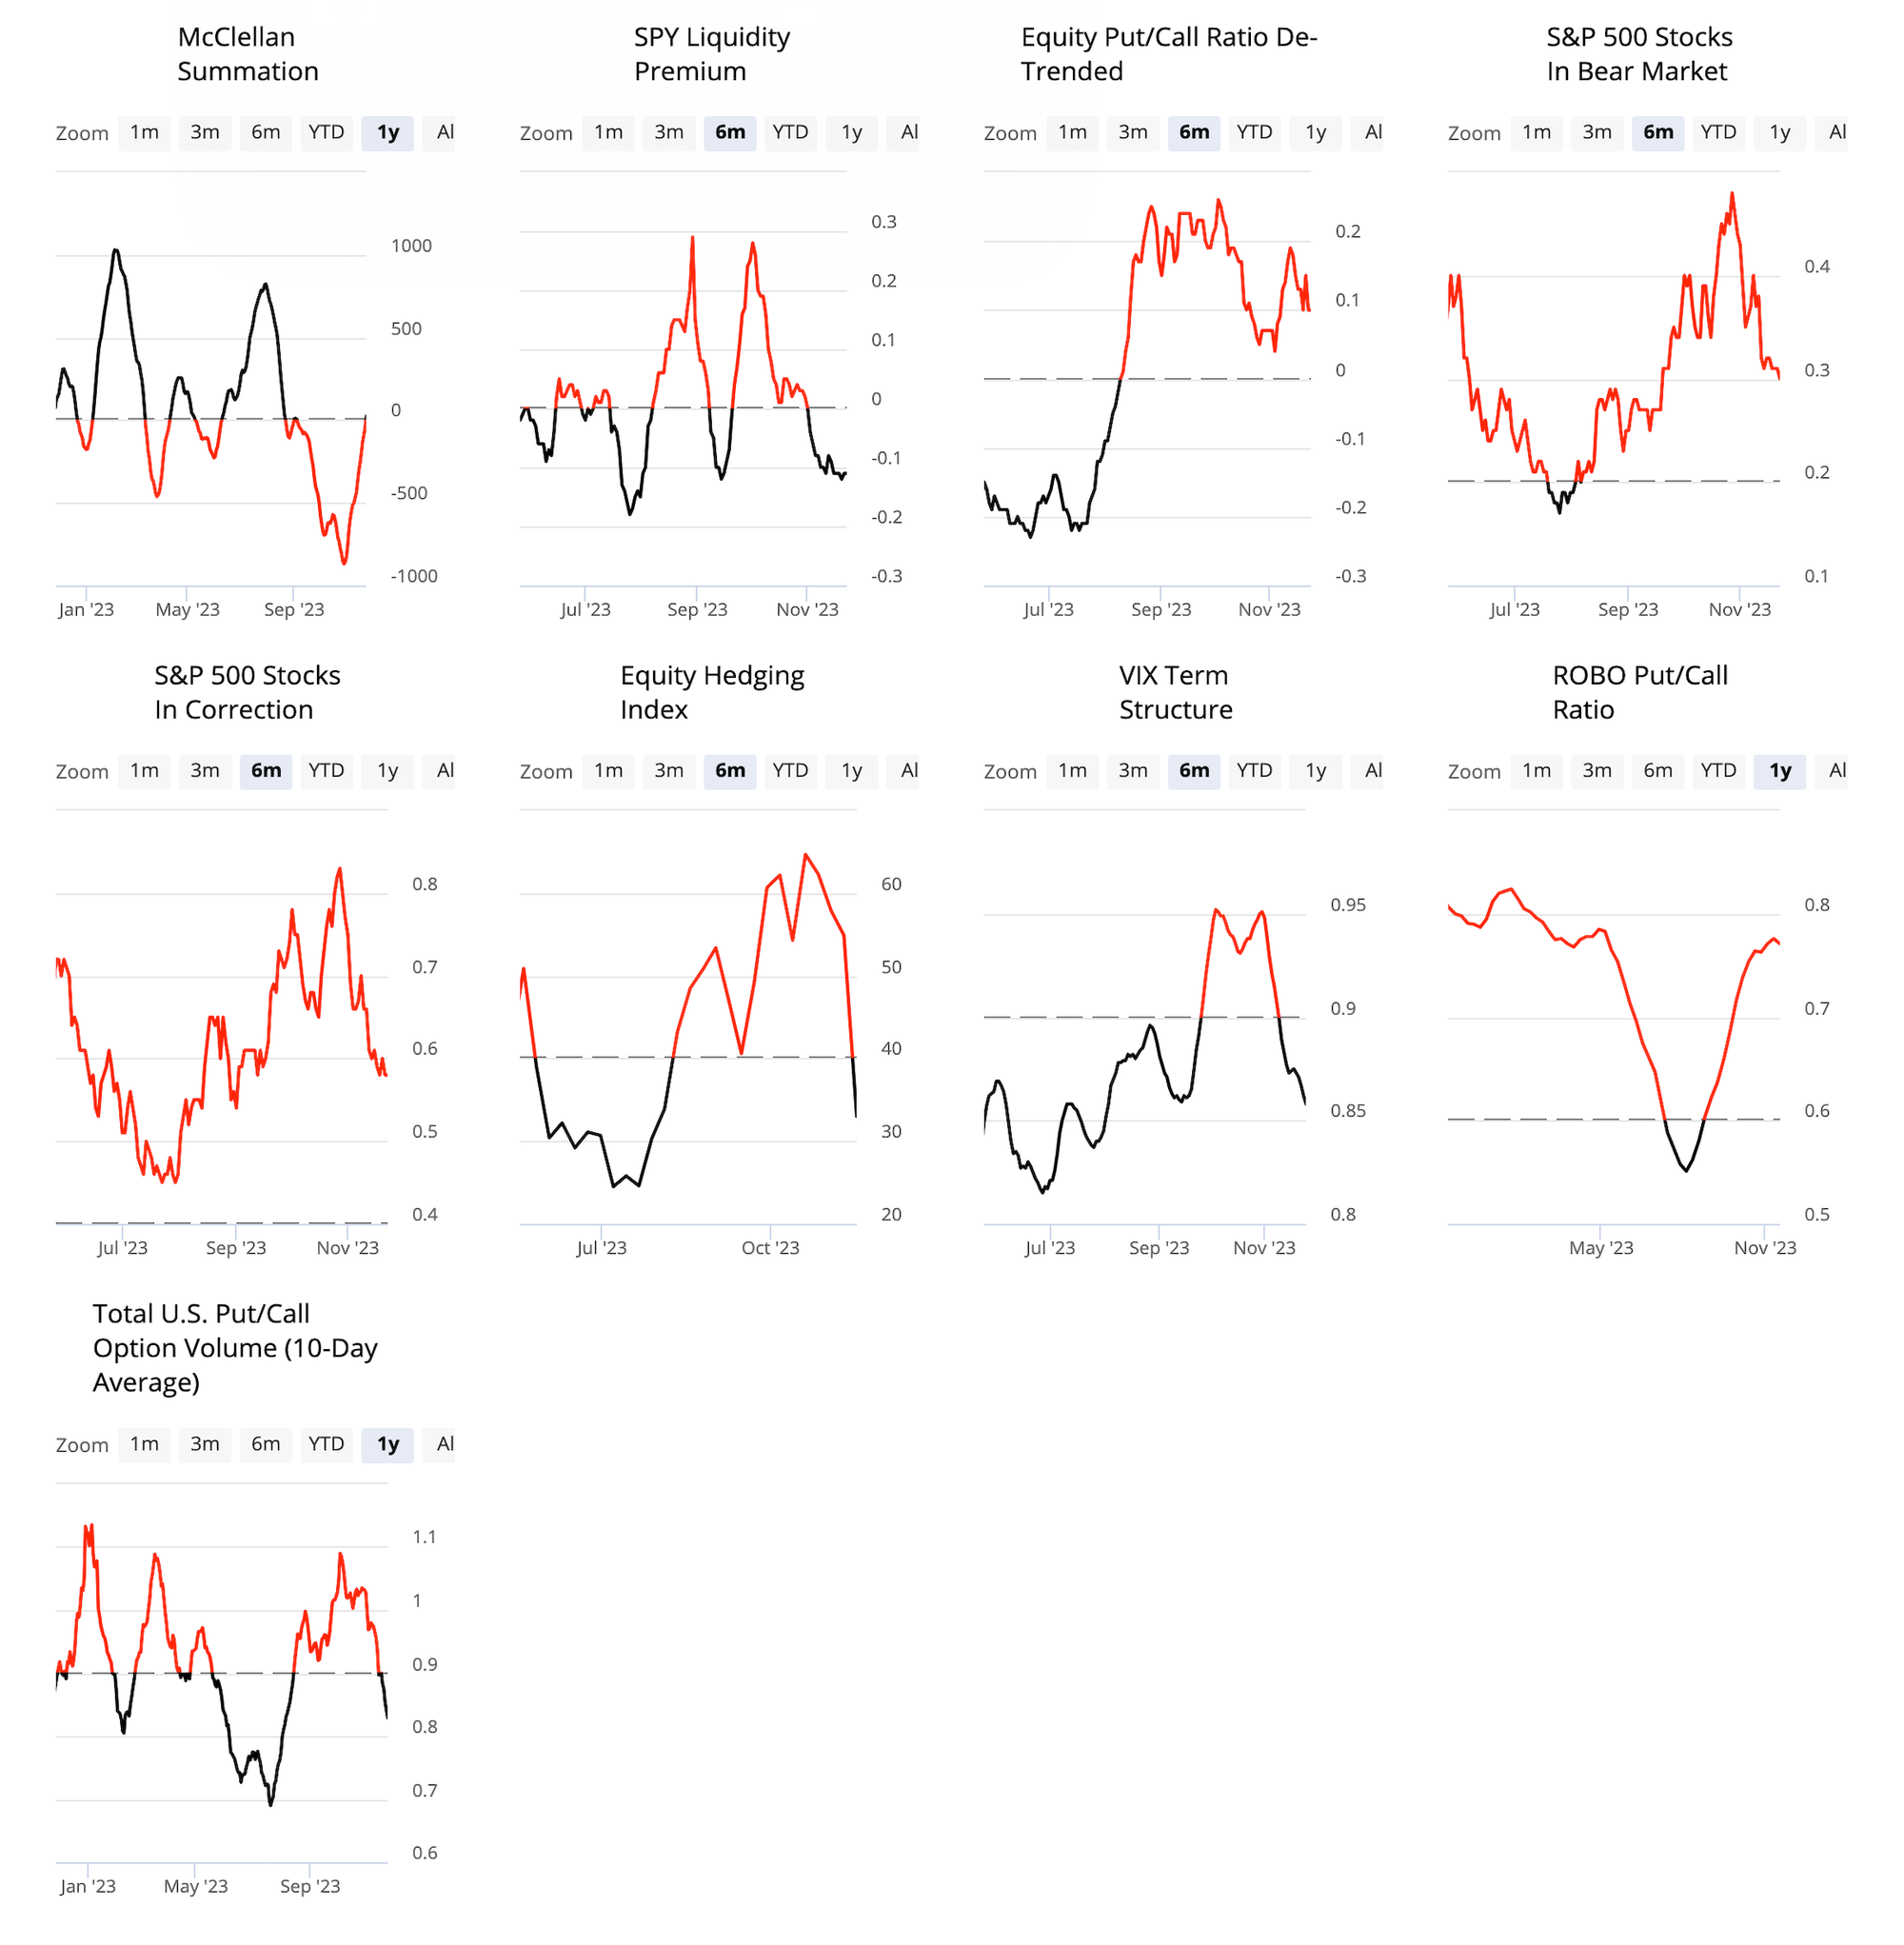
Indicators
| Name | Excess | UpDn | Last | Prior | % CHG | XS Optimism | XS Pessimism | Inverse | Index |
|---|---|---|---|---|---|---|---|---|---|
Current Year Performance | 🔴 Optimism | 🔵 | 19.23 | 17.4 | 10.52 | 10 | -10 | ||
Average of All Years | ⚫️ Index (N/A) | 🔵 | 6.2 | 3.83 | 61.88 | 0 | 0 | ||
Intermediate Term Optimism Index | 🔴 Optimism | 🔵 | 71 | 66 | 7.58 | 65 | 35 | ||
CRB Optix | ⚪️ Normal | 🔴 | 47 | 48 | -2.08 | 60 | 40 | ||
Bond Optix | 🟢 Pessimism | 🔵 | 40 | 34 | 17.65 | 70 | 40 | ||
HYG Optix | ⚪️ Normal | 🔴 | 63.71 | 77.66 | -17.96 | 80 | 20 | ||
US Dollar Optix | ⚪️ Normal | 🔴 | 52 | 54 | -3.7 | 60 | 40 | ||
BBB - AAA Corporate Bond Spread | ⚫️ Index (N/A) | 🔴 | 0.94 | 0.97 | -3.09 | 0 | 0 | ||
Crude Oil Optix | ⚪️ Normal | 🔴 | 45 | 46 | -2.17 | 60 | 30 | ||
Gold Optix | ⚪️ Normal | 🔵 | 57 | 54 | 5.56 | 70 | 30 |
.svg?id=eeead860-fa40-45f8-a65d-1ef6fc5887bd&table=block)
.svg?id=533817eb-56ff-48cb-8a6a-bfcdd4fe00ce&table=block)

.svg?id=6b009592-97c0-4082-8b92-50c8cbd220d5&table=block)


| Name | Excess | UpDn | Last | Prior | % CHG | XS Optimism | XS Pessimism | Inverse | Index |
|---|---|---|---|---|---|---|---|---|---|
Options Speculation Index | 🔴 Optimism | ⚪️ | 1.19 | 1.19 | 0 | 1.15 | 0.9 | ||
ROBO Put/Call Ratio | ⚪️ Normal | ⚪️ | 0.68 | 0.68 | 0 | 0.5 | 0.75 | ||
Stock Bond Ratio | ⚪️ Normal | 🔵 | 1.43 | 1.15 | 24.35 | 2 | -2 | ||
GEX / Market Cap Ratio | ⚪️ Normal | ⚪️ | 0.1 | 0.1 | 0 | 0.15 | 0.05 |
.svg?id=73b6c2cb-c2db-4c22-a425-452b39462476&table=block)

| Name | Excess | UpDn | Last | Prior | % CHG | XS Optimism | XS Pessimism | Inverse | Index |
|---|---|---|---|---|---|---|---|---|---|
Small Trader Put/Call Premium | ⚪️ Normal | ⚪️ | 0.53 | 0.53 | 0 | 0.4 | 0.6 | ||
Risk On/Off Index | 🔴 Optimism | ⚪️ | 52.38 | 52.38 | 0 | 50 | 0 | ||
MOVE Index | 🟢 Pessimism | 🔴 | 107.43 | 113.11 | -5.02 | 60 | 100 | ||
2y / 10y Yield Curve | ⚫️ Index (N/A) | 🔴 | -48.62 | -45.22 | -7.52 | 0 | 0 |

.svg?id=6b578e0f-525c-4251-a949-e44ce40ec88a&table=block)
| Name | Excess | UpDn | Last | Prior | % CHG | XS Optimism | XS Pessimism | Inverse | Index |
|---|---|---|---|---|---|---|---|---|---|
VIX Term Structure | ⚪️ Normal | 🔴 | 0.82 | 0.87 | -5.75 | 0.8 | 1 | ||
Component Correlation | ⚪️ Normal | ⚪️ | 0.46 | 0.46 | 0 | 0.35 | 0.55 | ||
Gamma Exposure (x000) | 🔴 Optimism | 🔵 | 4,575,340 | 4,511,810 | 0 | 4,000,000 | 1,000,000 | ||
Credit Default Swaps | ⚫️ Index (N/A) | 🔴 | 403.96 | 415.17 | -2.7 | 0 | 0 |


| Name | Excess | UpDn | Last | Prior | % CHG | XS Optimism | XS Pessimism | Inverse | Index |
|---|---|---|---|---|---|---|---|---|---|
SPY Breadth (% > 50d MA) | 🔴 Optimism | 🔵 | 76.55 | 72.06 | 6.23 | 70 | 30 | ||
SPY Breadth (% > 200d MA) | ⚪️ Normal | 🔵 | 58.35 | 54.51 | 7.04 | 70 | 30 | ||
NYSE TRIN | ⚪️ Normal | 🔵 | 1.12 | 0.89 | 25.84 | 0.5 | 2 | ||
NYSE Advance Decline | ⚫️ Index (N/A) | 🔵 | 683,887 | 681,963 | 0.29 | 0 | 0 |
.svg?id=5ad2c3f5-fabe-427d-8b4a-b1ffa06944fe&table=block)

ALL CONTENT WITHIN THIS SITE IS SOLELY GENERATED AS OPINION FOR THE INTERNAL USE OF QUESTRA ADVISORS LLC ("QALLC").
NO PART OF THIS SITE SHOULD BE CONSIDERED AN OFFER TO BUY OR SELL ANY SORT OF SECURITY OR FINANCIAL PRODUCT. NO PART OF THIS SITE SHOULD BE CONSTRUED AS ADVISE OR A RECOMMENDATION FOR ANY SORT OF FINANCIAL TRANSACTION OR INVESTMENT ALLOCATION. FURTHERMORE, NO PART OF THIS SITE SHOULD BE CONSTRUED AS "RESEARCH" AS DESCRIBED BY FINRA/NYSE 472.
QALLC TRADES WITH ITS OWN CAPITAL; IT IS NOT A REGISTERED INVESTMENT ADVISOR, AND NOTHING IN QALLCs COMMENTARY IS INTENDED, AND IT SHOULD NOT BE CONSTRUED, TO BE INVESTMENT ADVICE. QALLCs COMMENTARY IS FOR INFORMATIONAL AND ENTERTAINMENT USE ONLY. ANY MENTION OF QALLCs COMMENTARY OF A PARTICULAR SECURITY, INDEX, DERIVATIVE, OR OTHER INSTRUMENT IS NEITHER A RECOMMENDATION BY QALLC TO BUY, SELL OR HOLD THAT SECURITY, INDEX, DERIVATIVE, OR OTHER INSTRUMENT, NOR DOES IT CONSTITUTE AN OPINION OF QALLC AS TO THE SUITABILITY OF THAT SECURITY, INDEX, DERIVATIVE, OR OTHER INSTRUMENT FOR ANY PARTICULAR PURPOSE. QALLC IS NOT IN THE BUSINESS OF GIVING INVESTMENT ADVICE OR ADVICE REGARDING THE SUITABILITY FOR ANY PURPOSE OF ANY SECURITY, INDEX, DERIVATIVE, OTHER INSTRUMENT OR TRADING STRATEGY, AND NOTHING IN QALLCs COMMENTARY SHOULD BE SO USED OR RELIED UPON.
QALLC HEREBY EXPRESSLY DISCLAIMS ANY AND ALL REPRESENTATIONS AND WARRANTIES THAT: (a) THE CONTENT OF ITS WEEKLY REPORTS ARE CORRECT, ACCURATE, COMPLETE, OR RELIABLE; (b) ANY OF ITS WEEKLY REPORTS WILL BE AVAILABLE AT ANY PARTICULAR TIME OR PLACE, OR IN ANY PARTICULAR MEDIUM; AND (c) THAT ANY OMISSION OR ERROR IN ANY OF ITS WEEKLY REPORTS WILL BE CORRECTED.
- Narratives - Heisenberg Report
- Week Ahead - Trading Economics
- Earnings - FactSet & LESG I/B/E/S
- Options - tradingvolatility.net
- Futures - CME Group
- Indicators - Sundial Capital Research